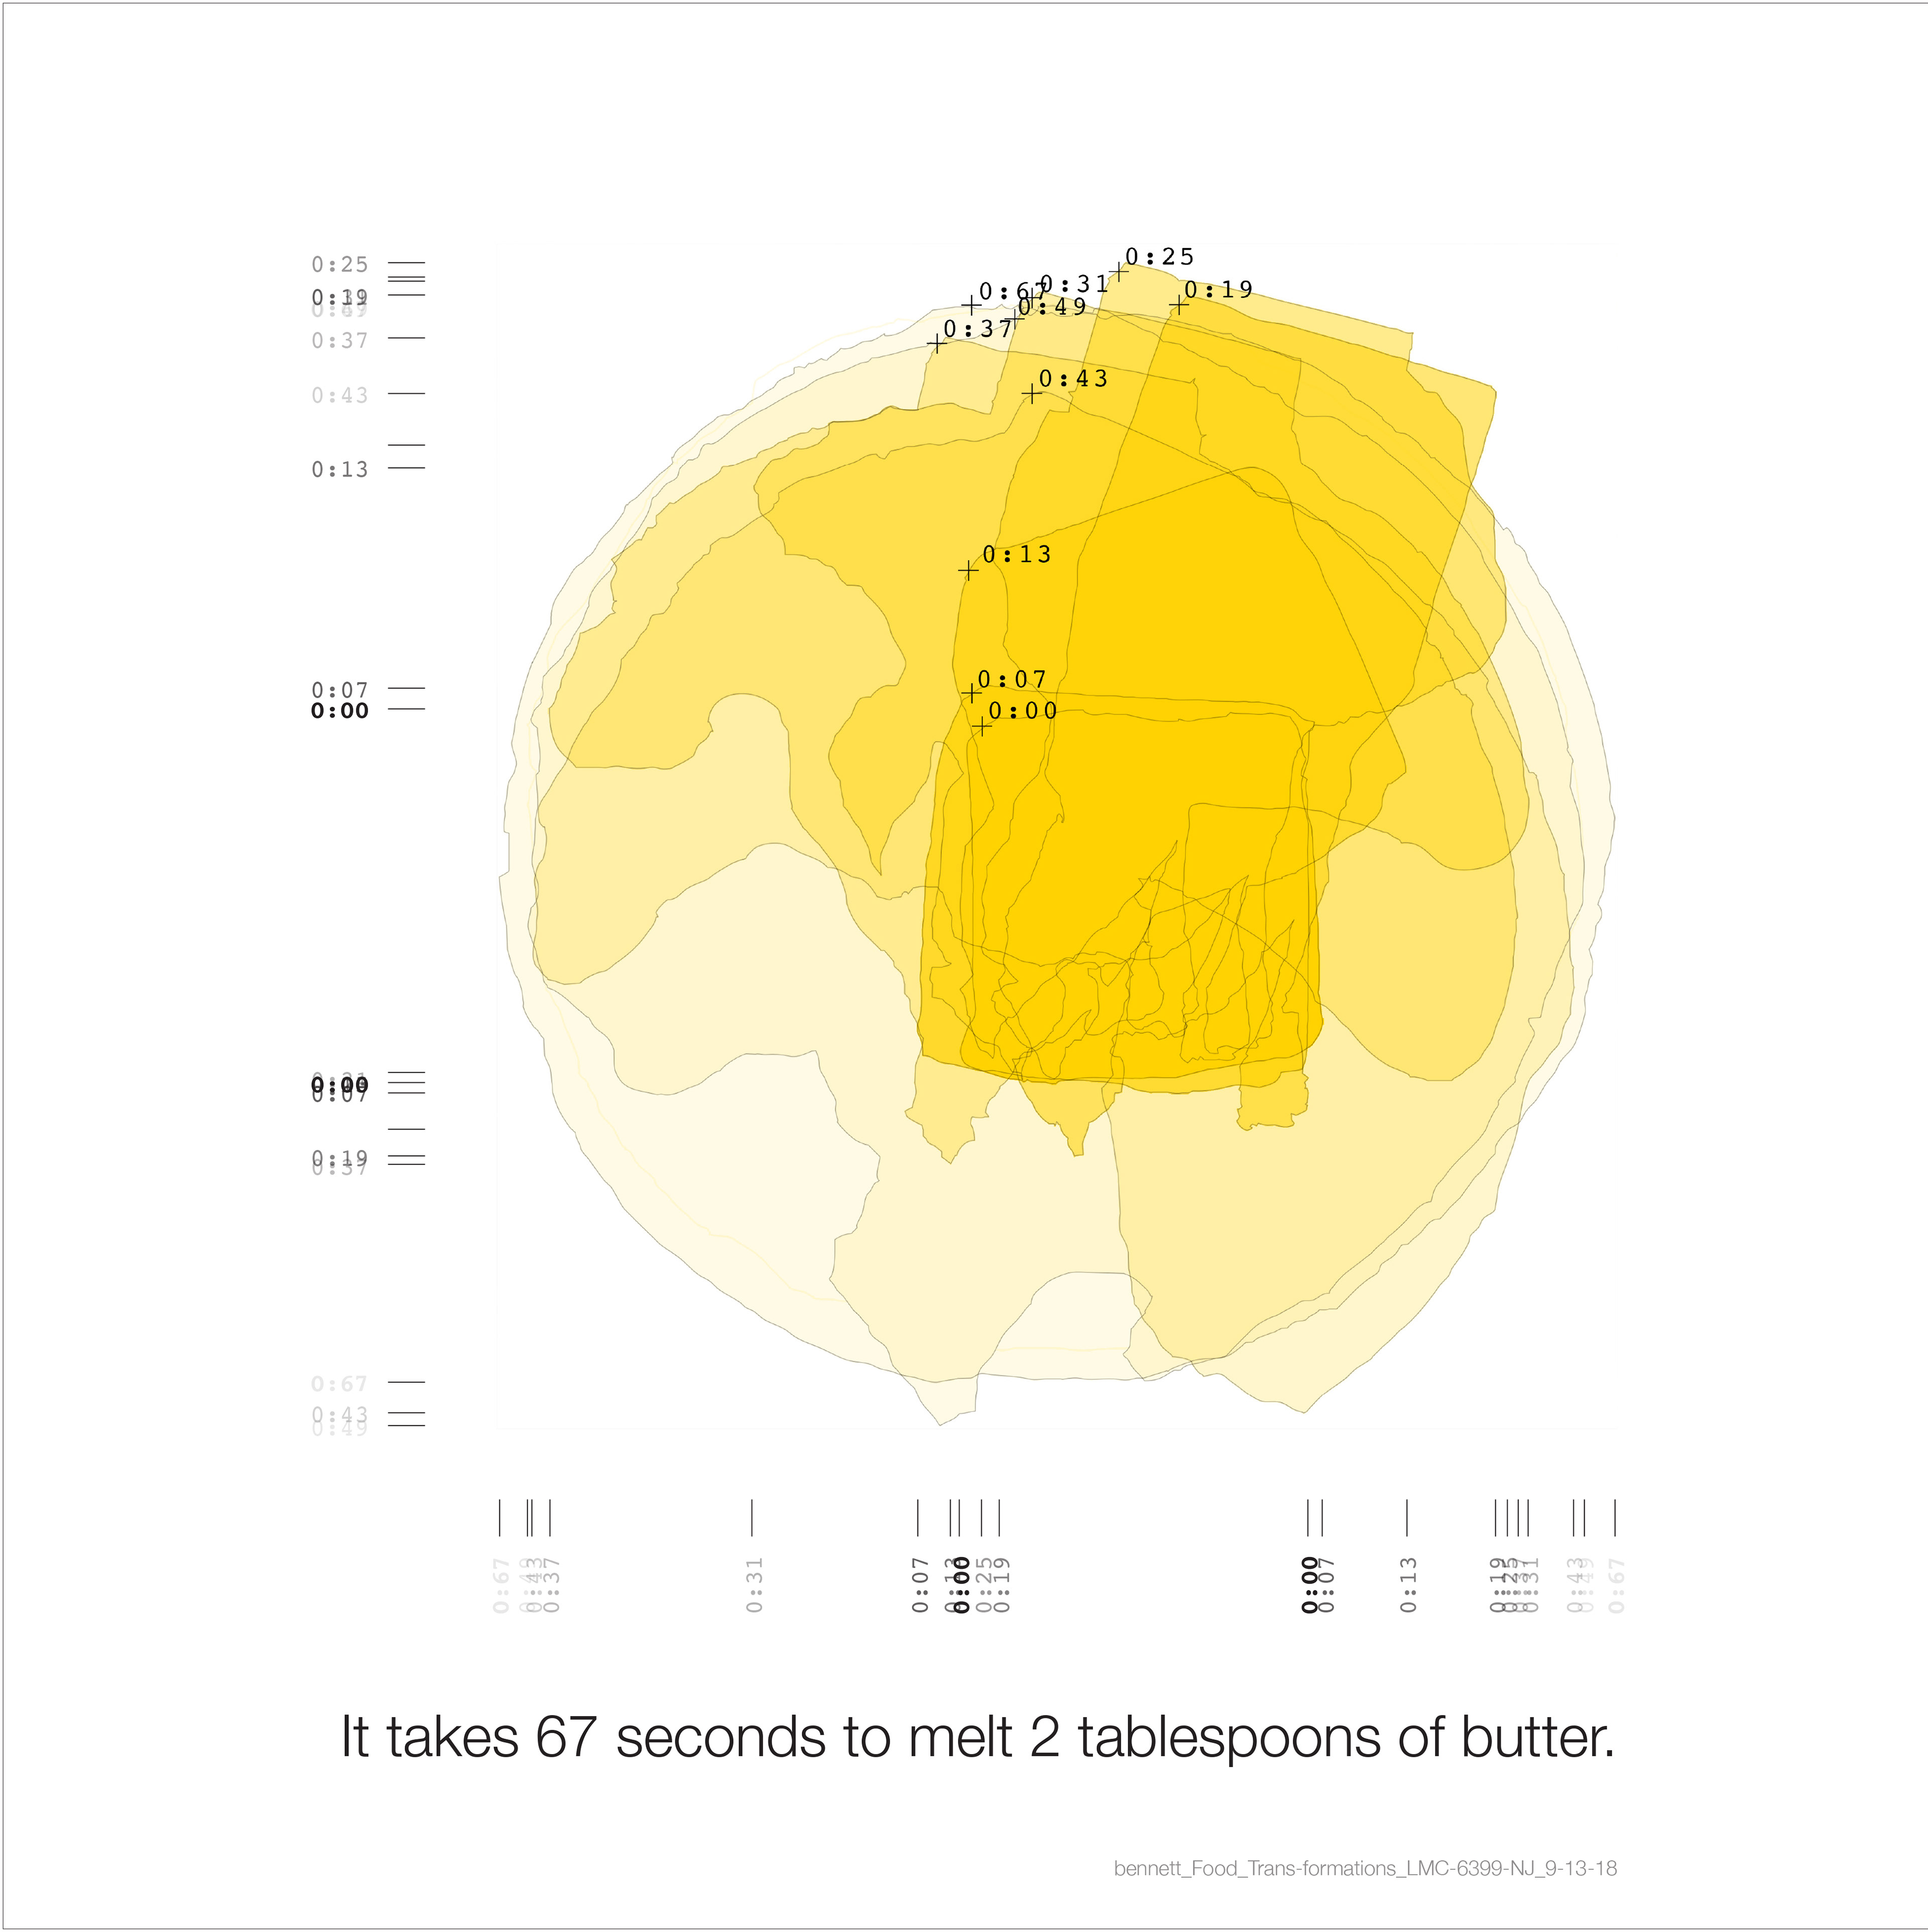
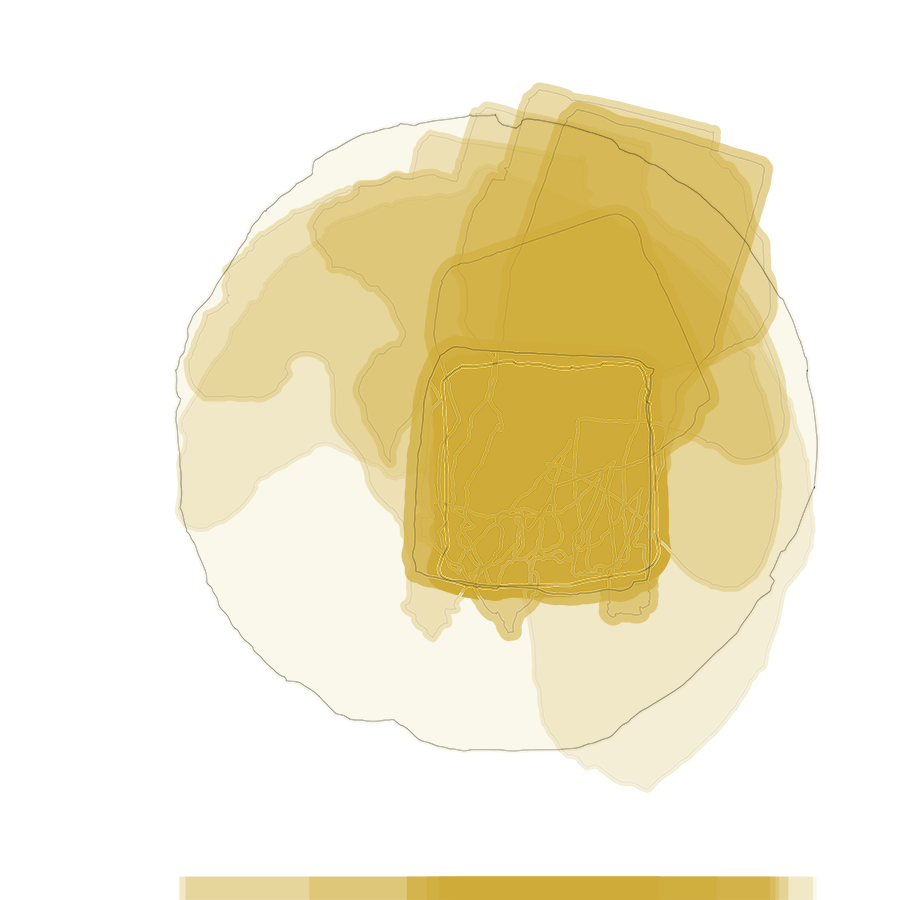
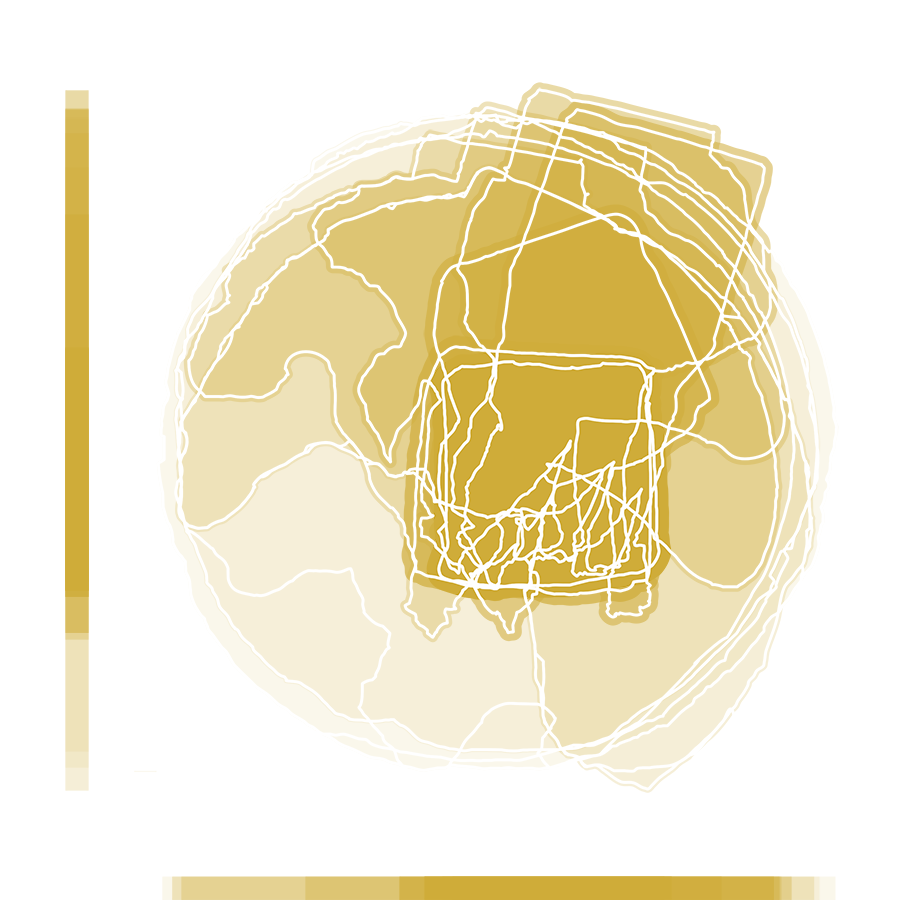
Food Trans-formations, 2018, Katherine Bennett. Final project image.
FOOD TRANS-FORMATIONS, 3-week group project with Jatin Arora and Christina Nguyen Bui, 23 August - 13 September 2018, LMC 6399, Discovery & Invention. This collaborative project maps transformative experiences associated with food as, itself, a site of transition. We can relate to food as an intimate, physical and cultural, engagement with the environments in which we prepare and consume our meals. Jatin, Christina, and I considered how these engagements can also evoke emotions of nostalgia as complex memories that are at once happy and sad, associated with feelings of comfort and loss. Such memories can affect how we experience food now, as we cook it, eat it, and store it.
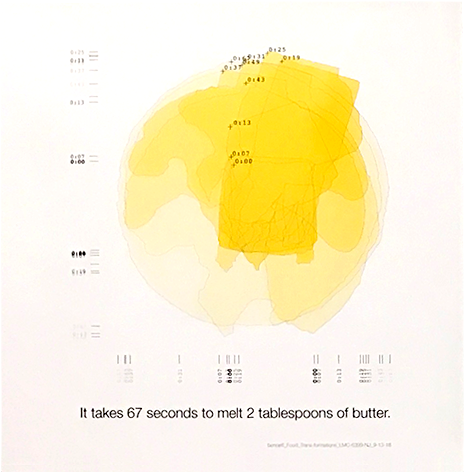
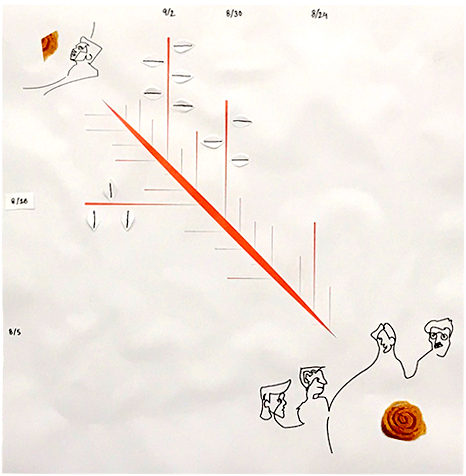
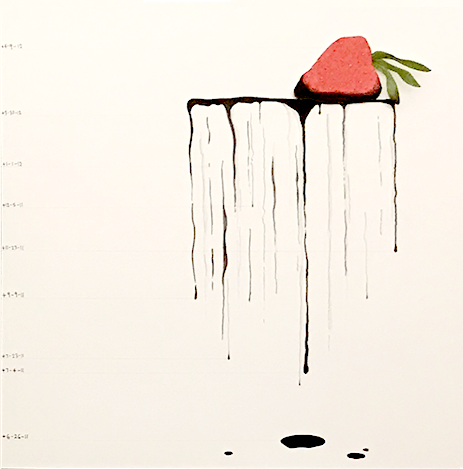
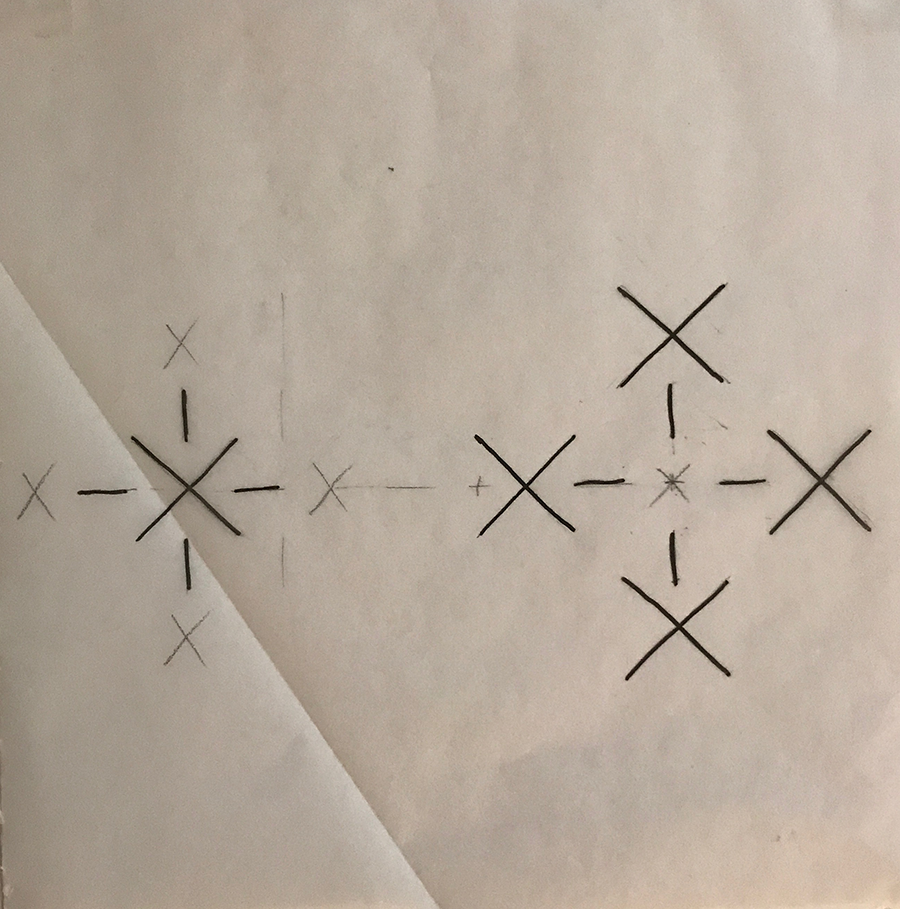
Map Series, 2018, Katherine Bennett, Jatin Arora, Christina Bui. Studio presentation.
Group maps. Our series of three maps represents food as a site of physical, cultural, and emotional transformation. Food changes form. It melts, tastes, and rots when we cook, eat, and store it. My map (left) traces the changing form of a two-tablespoon chunk of butter melting in a pan warmed on the stove. Jatin's map (center) locates different places and circumstances of tasting the Indian sweet treat Jalebi after a trans-continental move (see Jatin's description). Christina's map (right) follows the dripping decomposition of a beautifully ripe strawberry forgotten during a family death (see Christina's description).
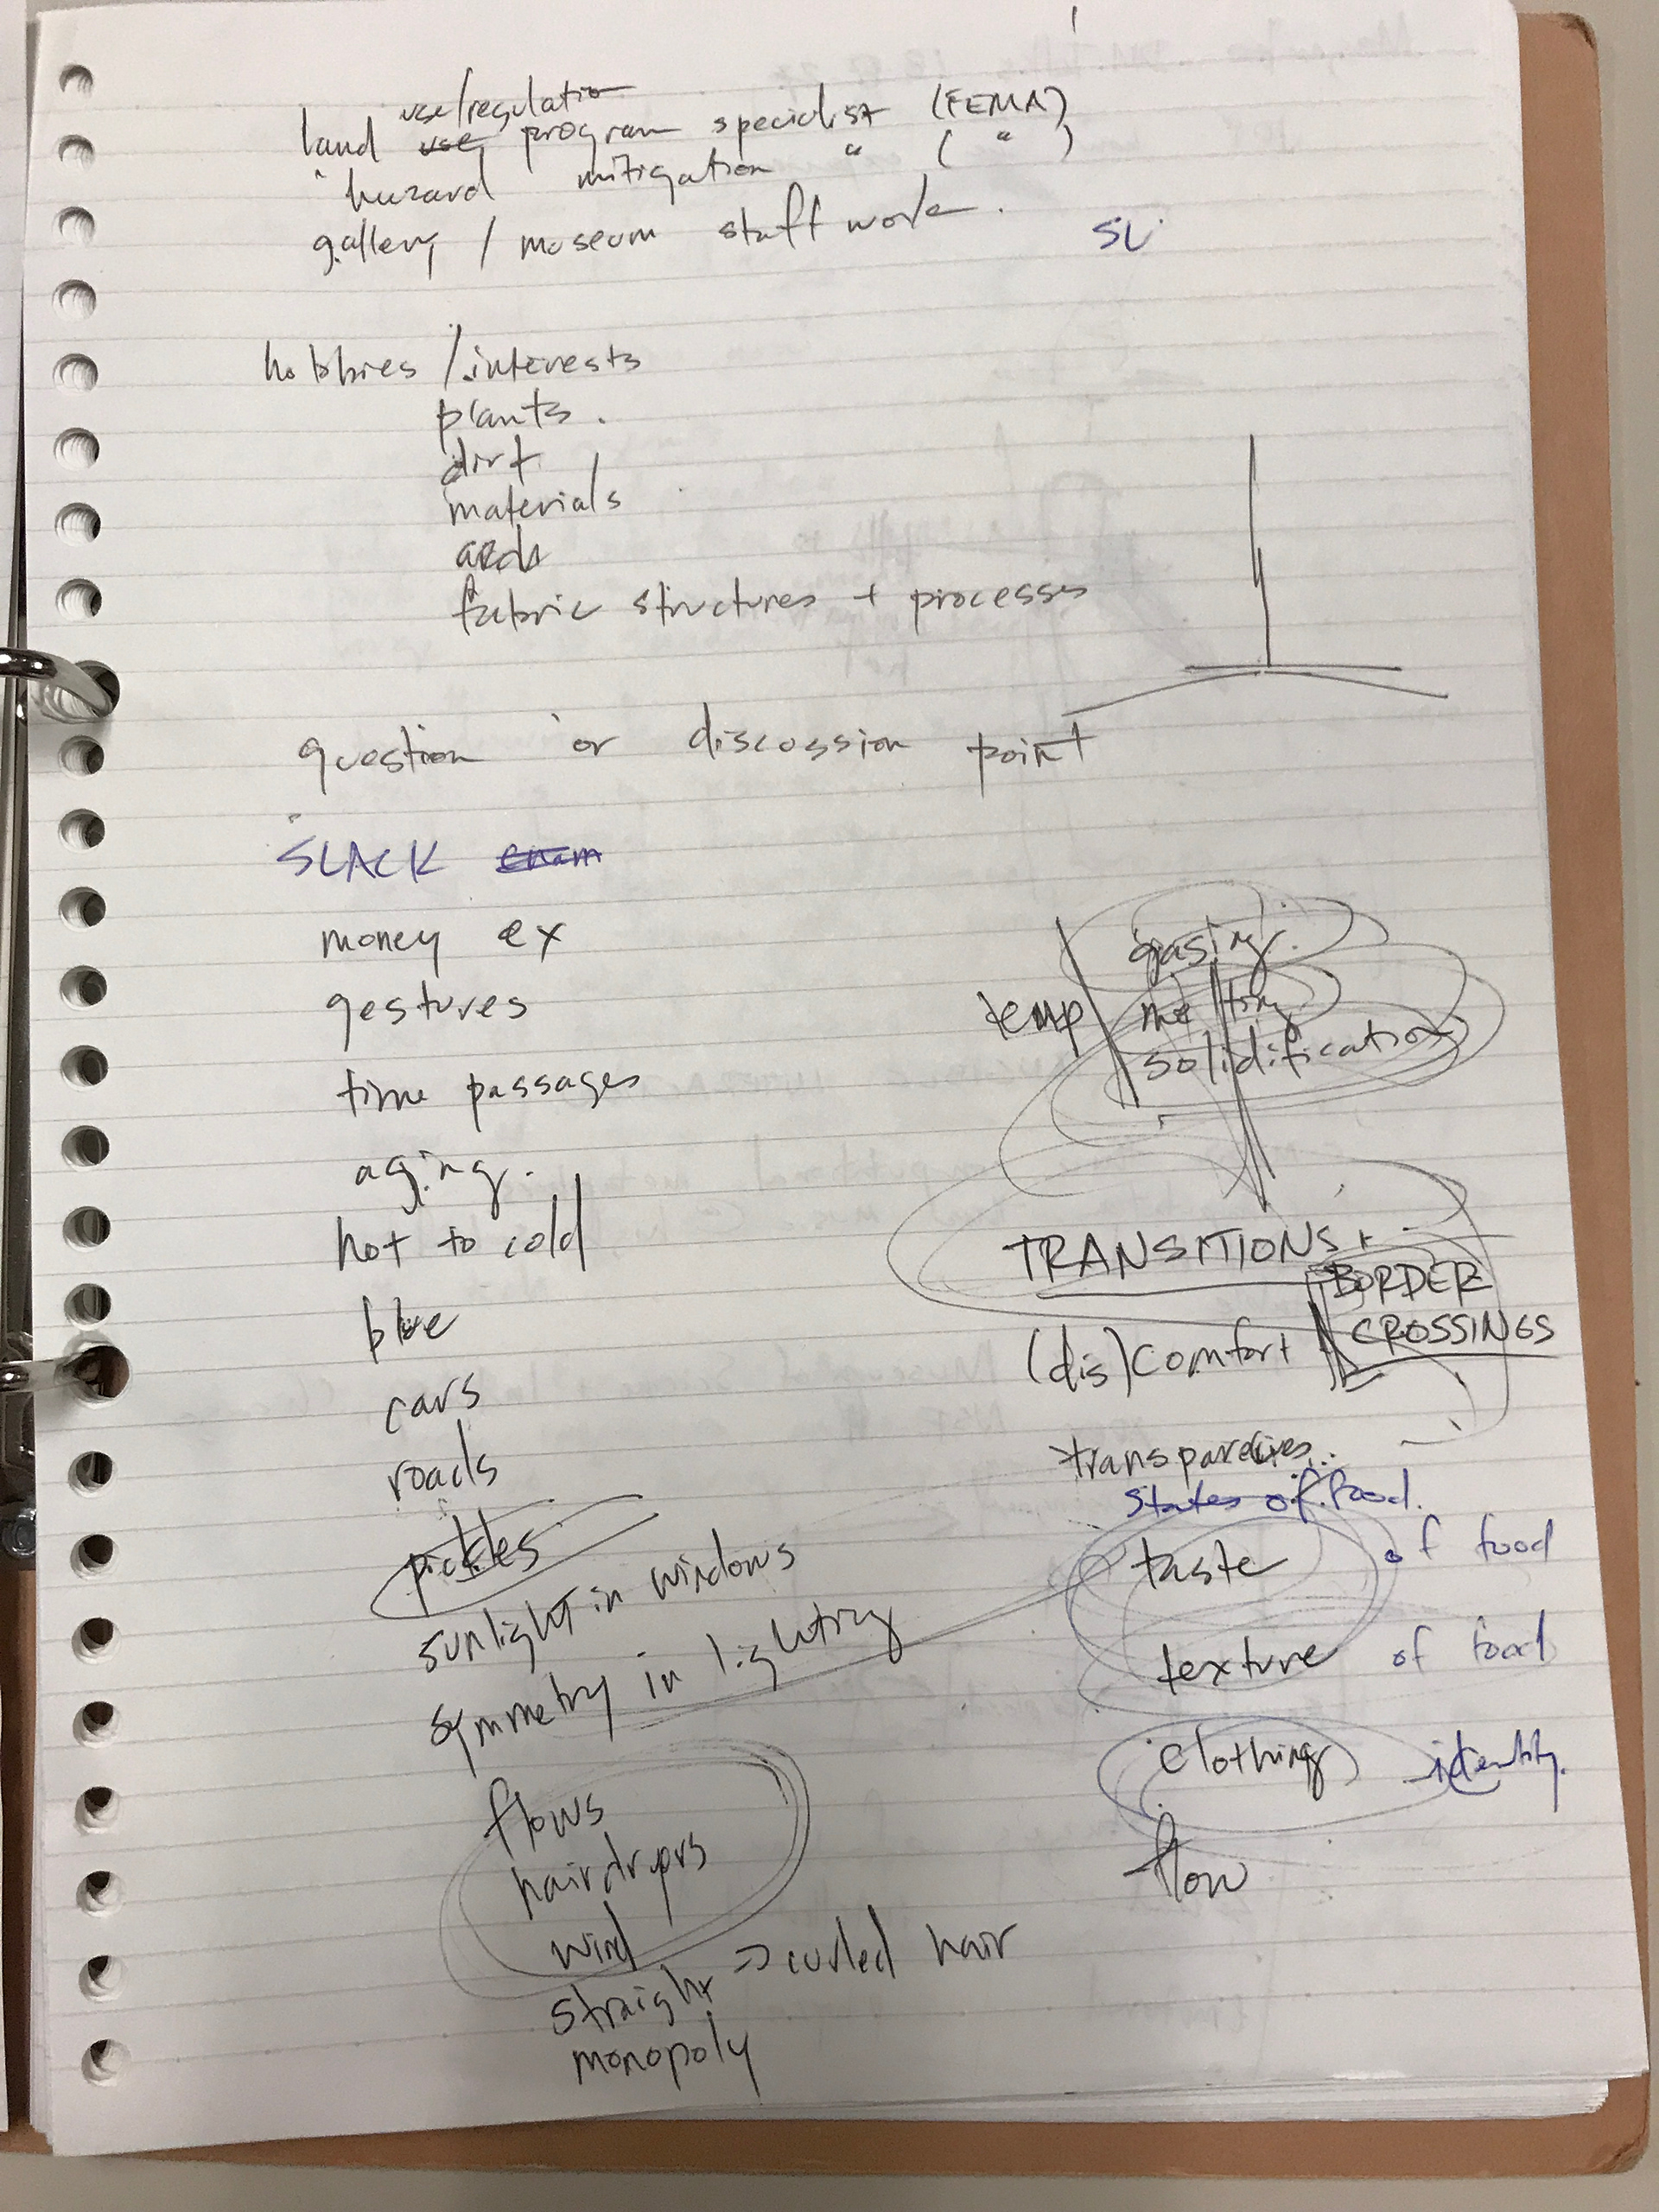
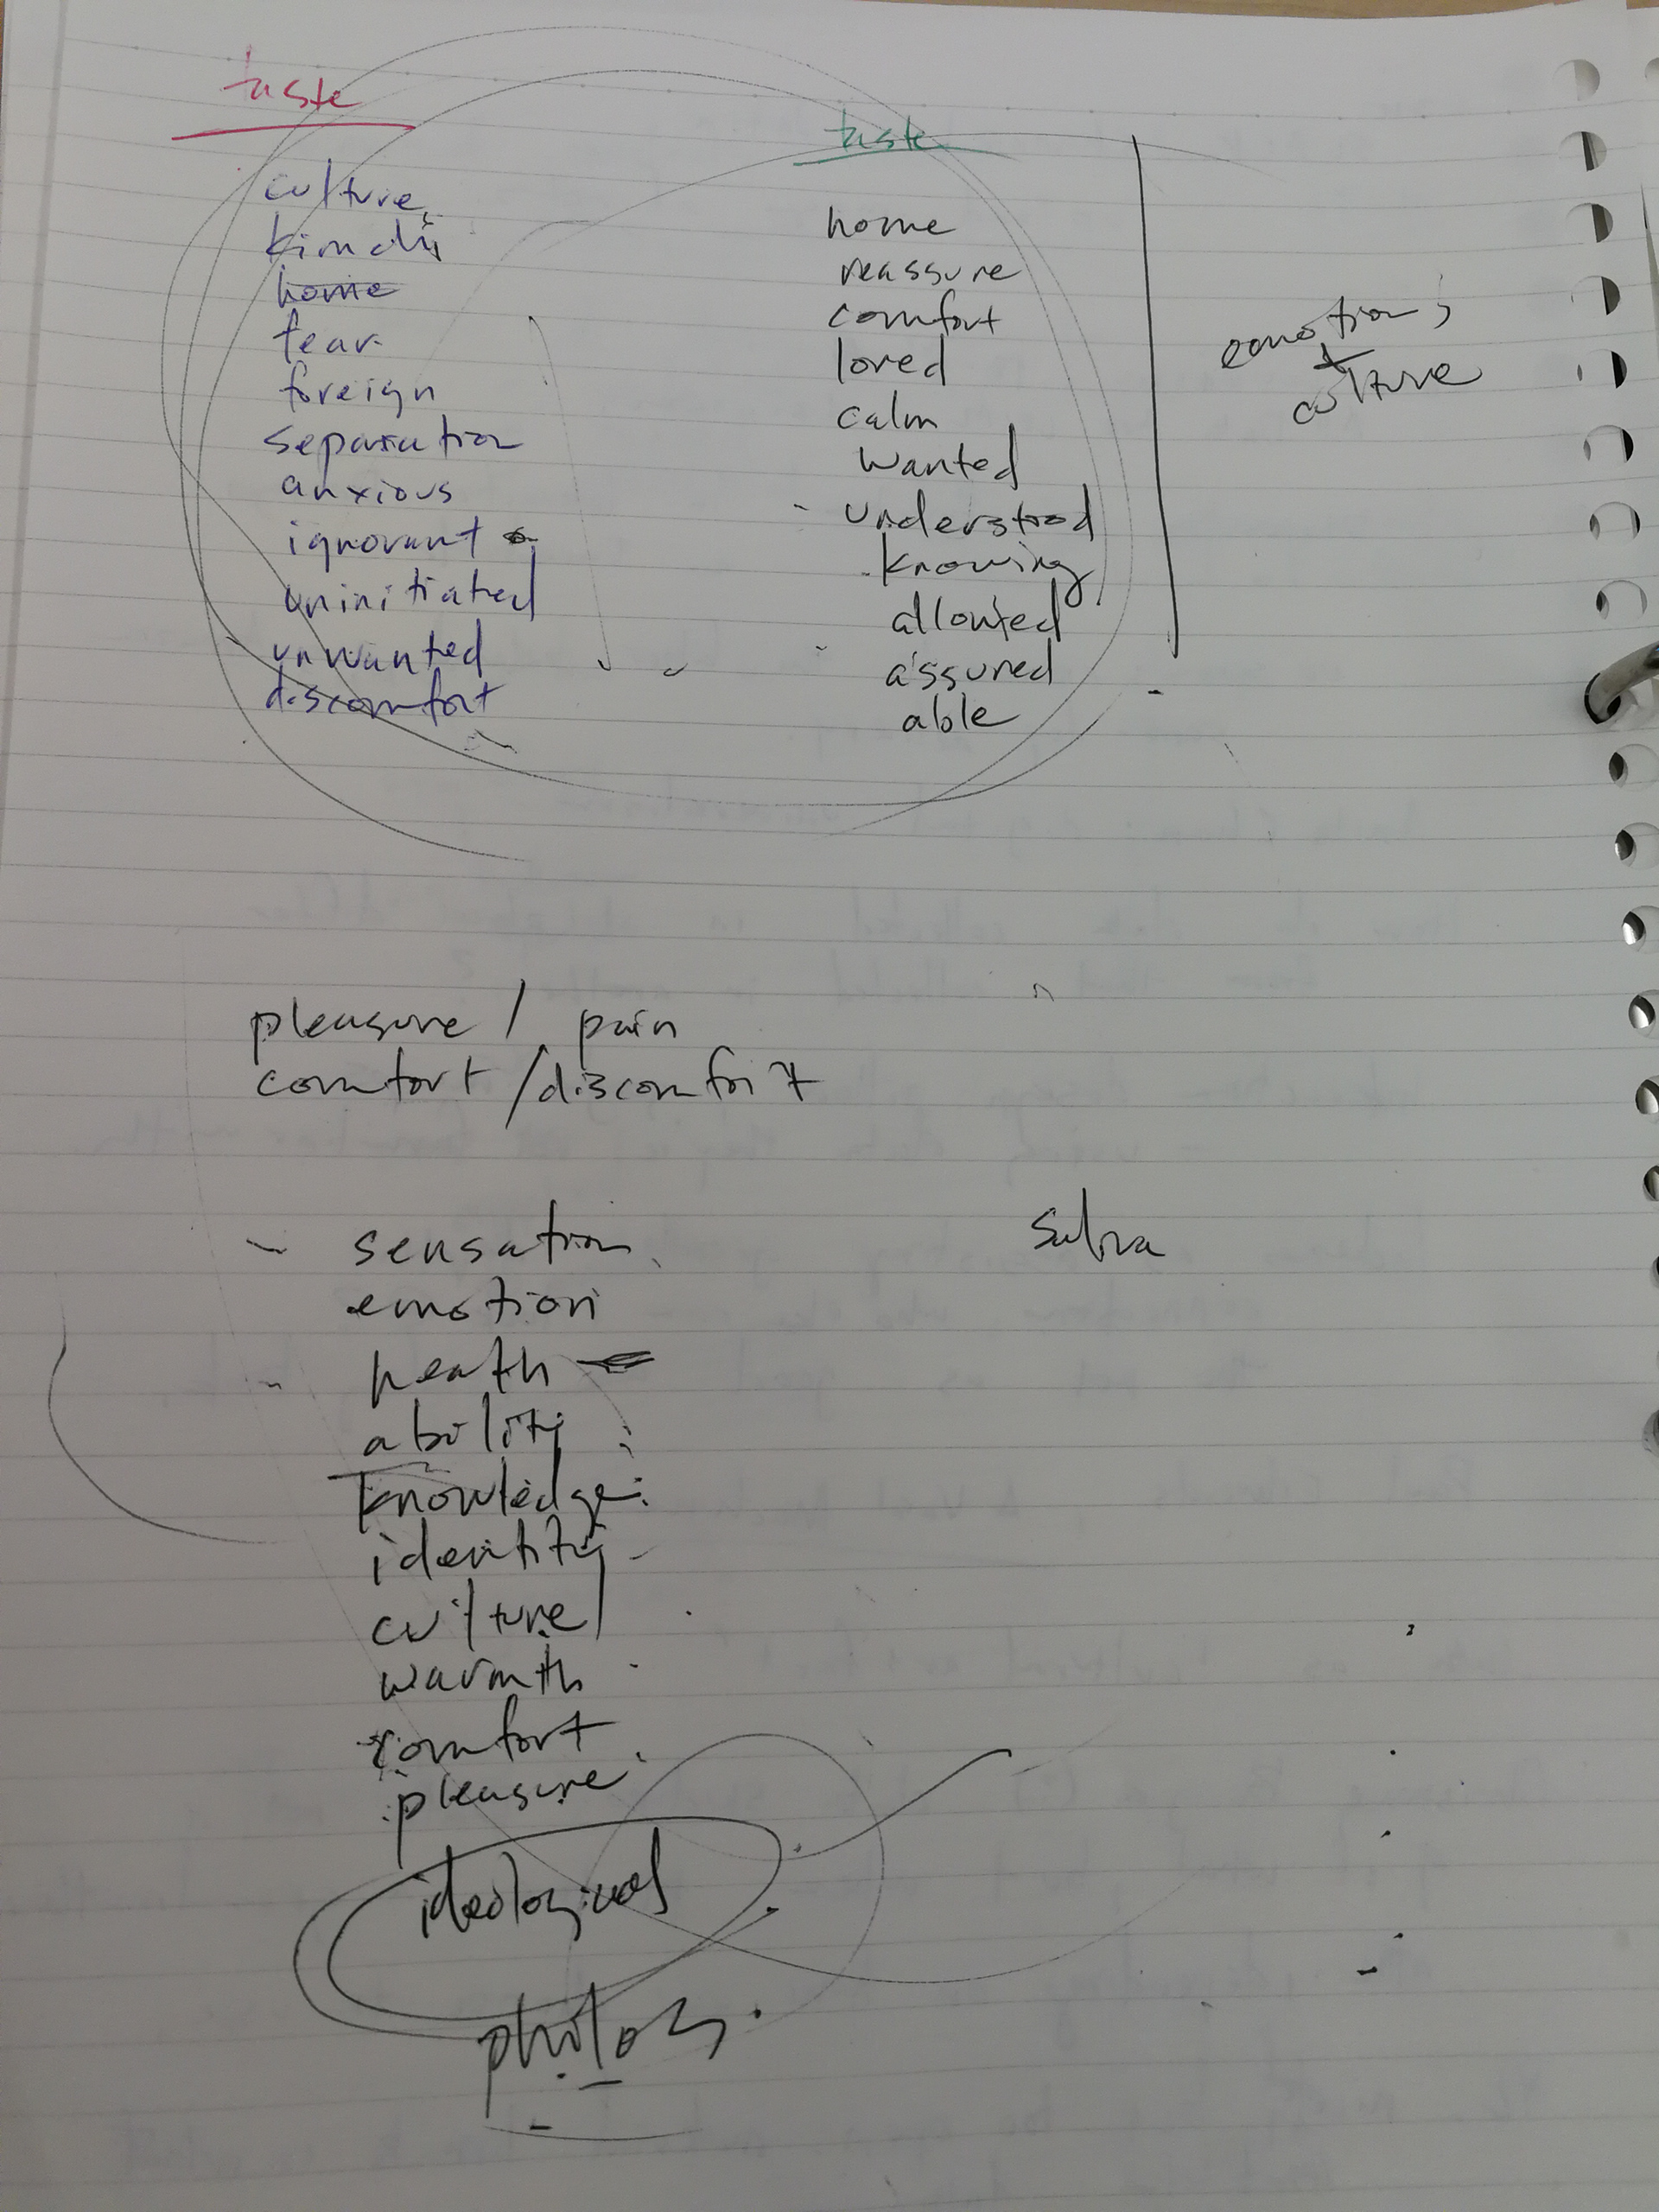
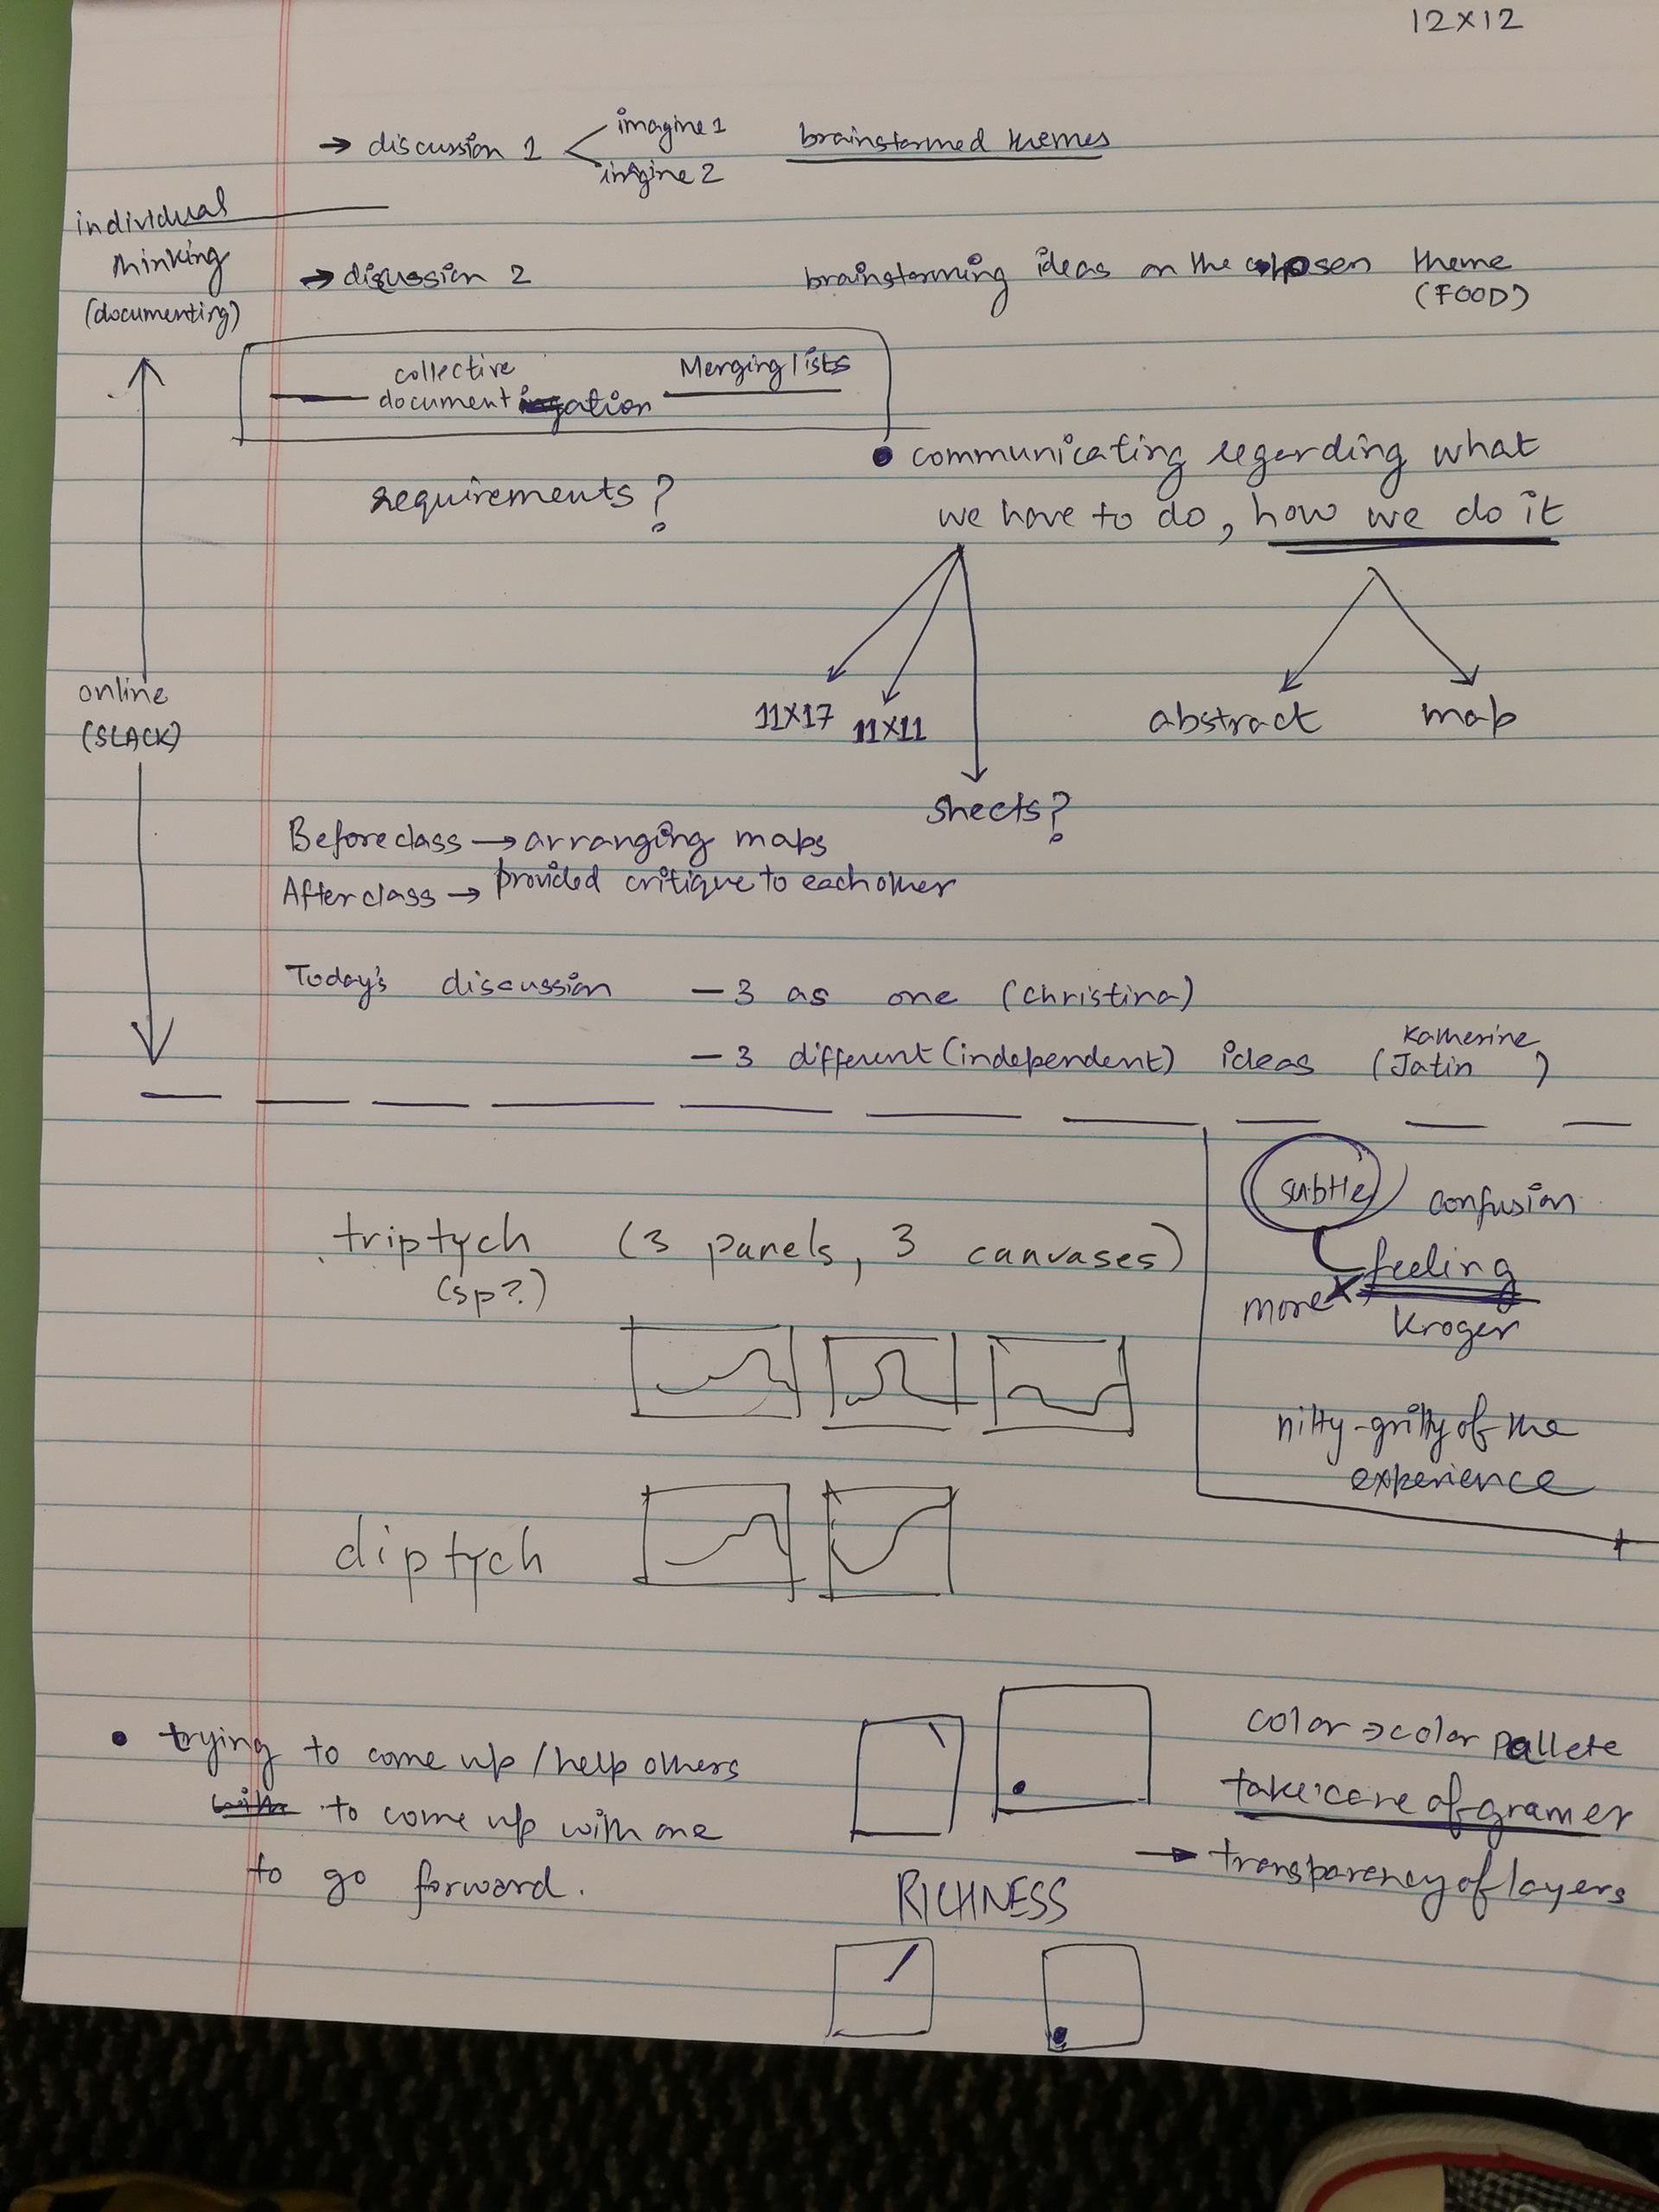
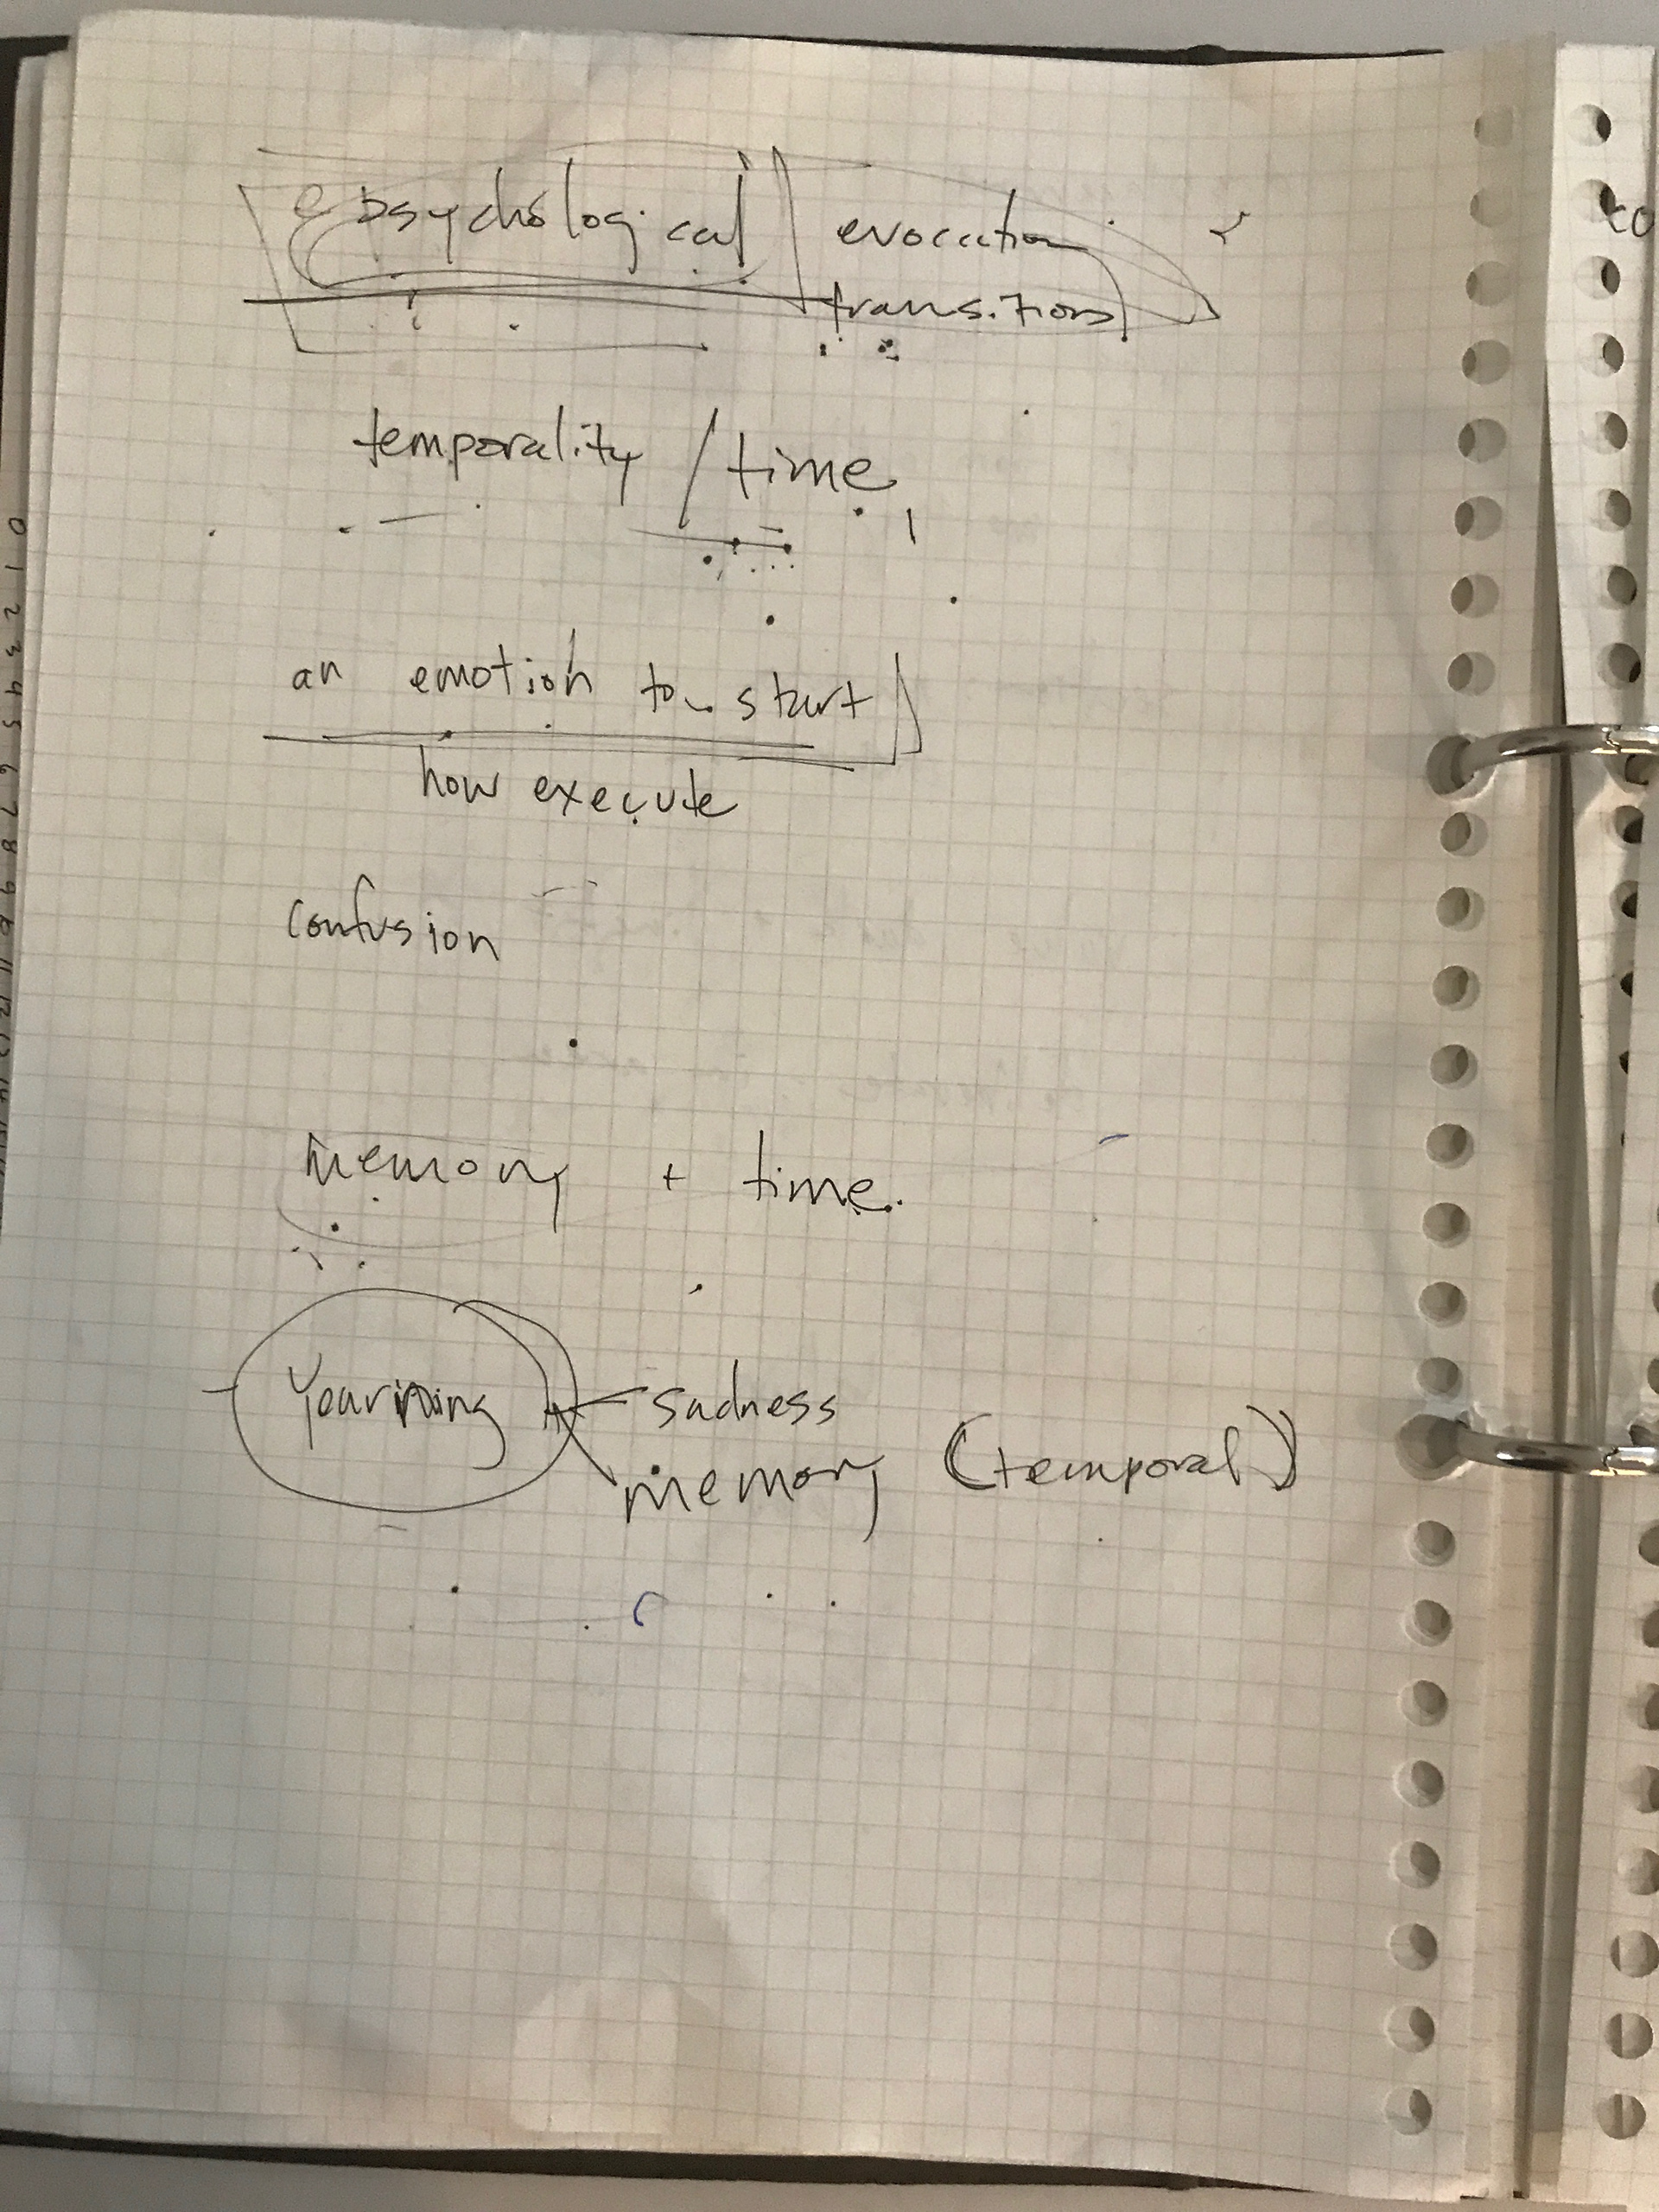
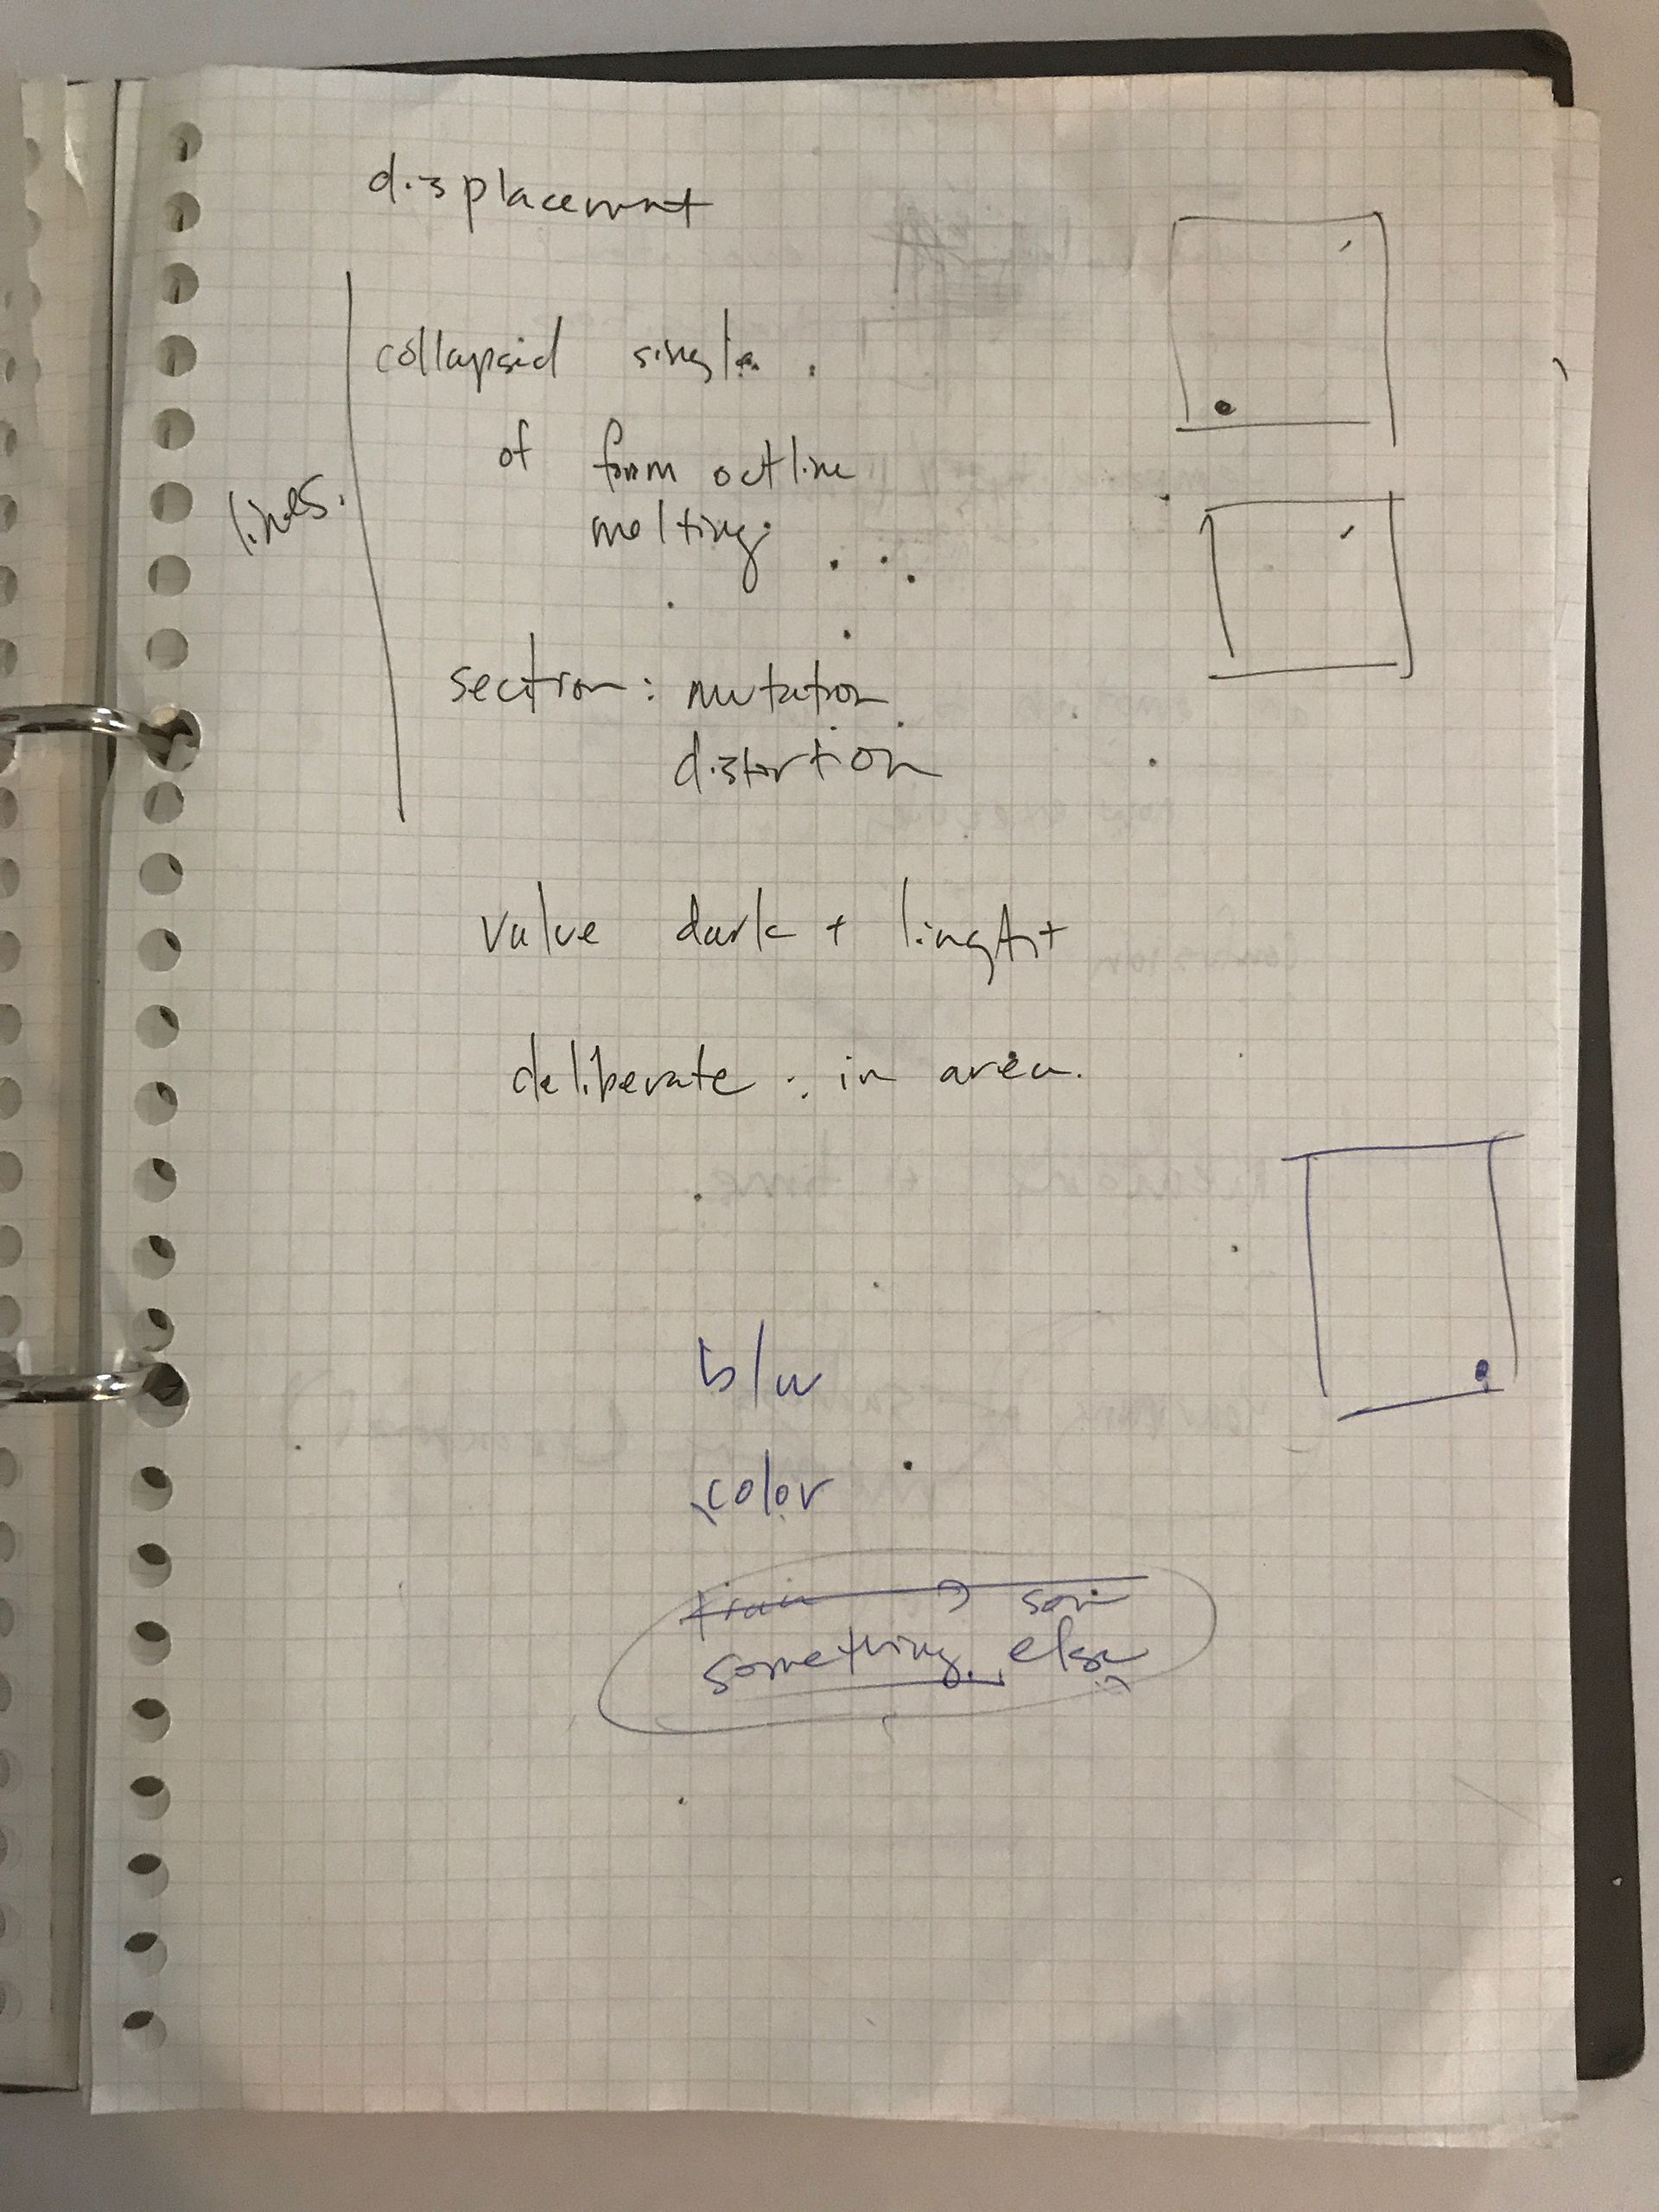
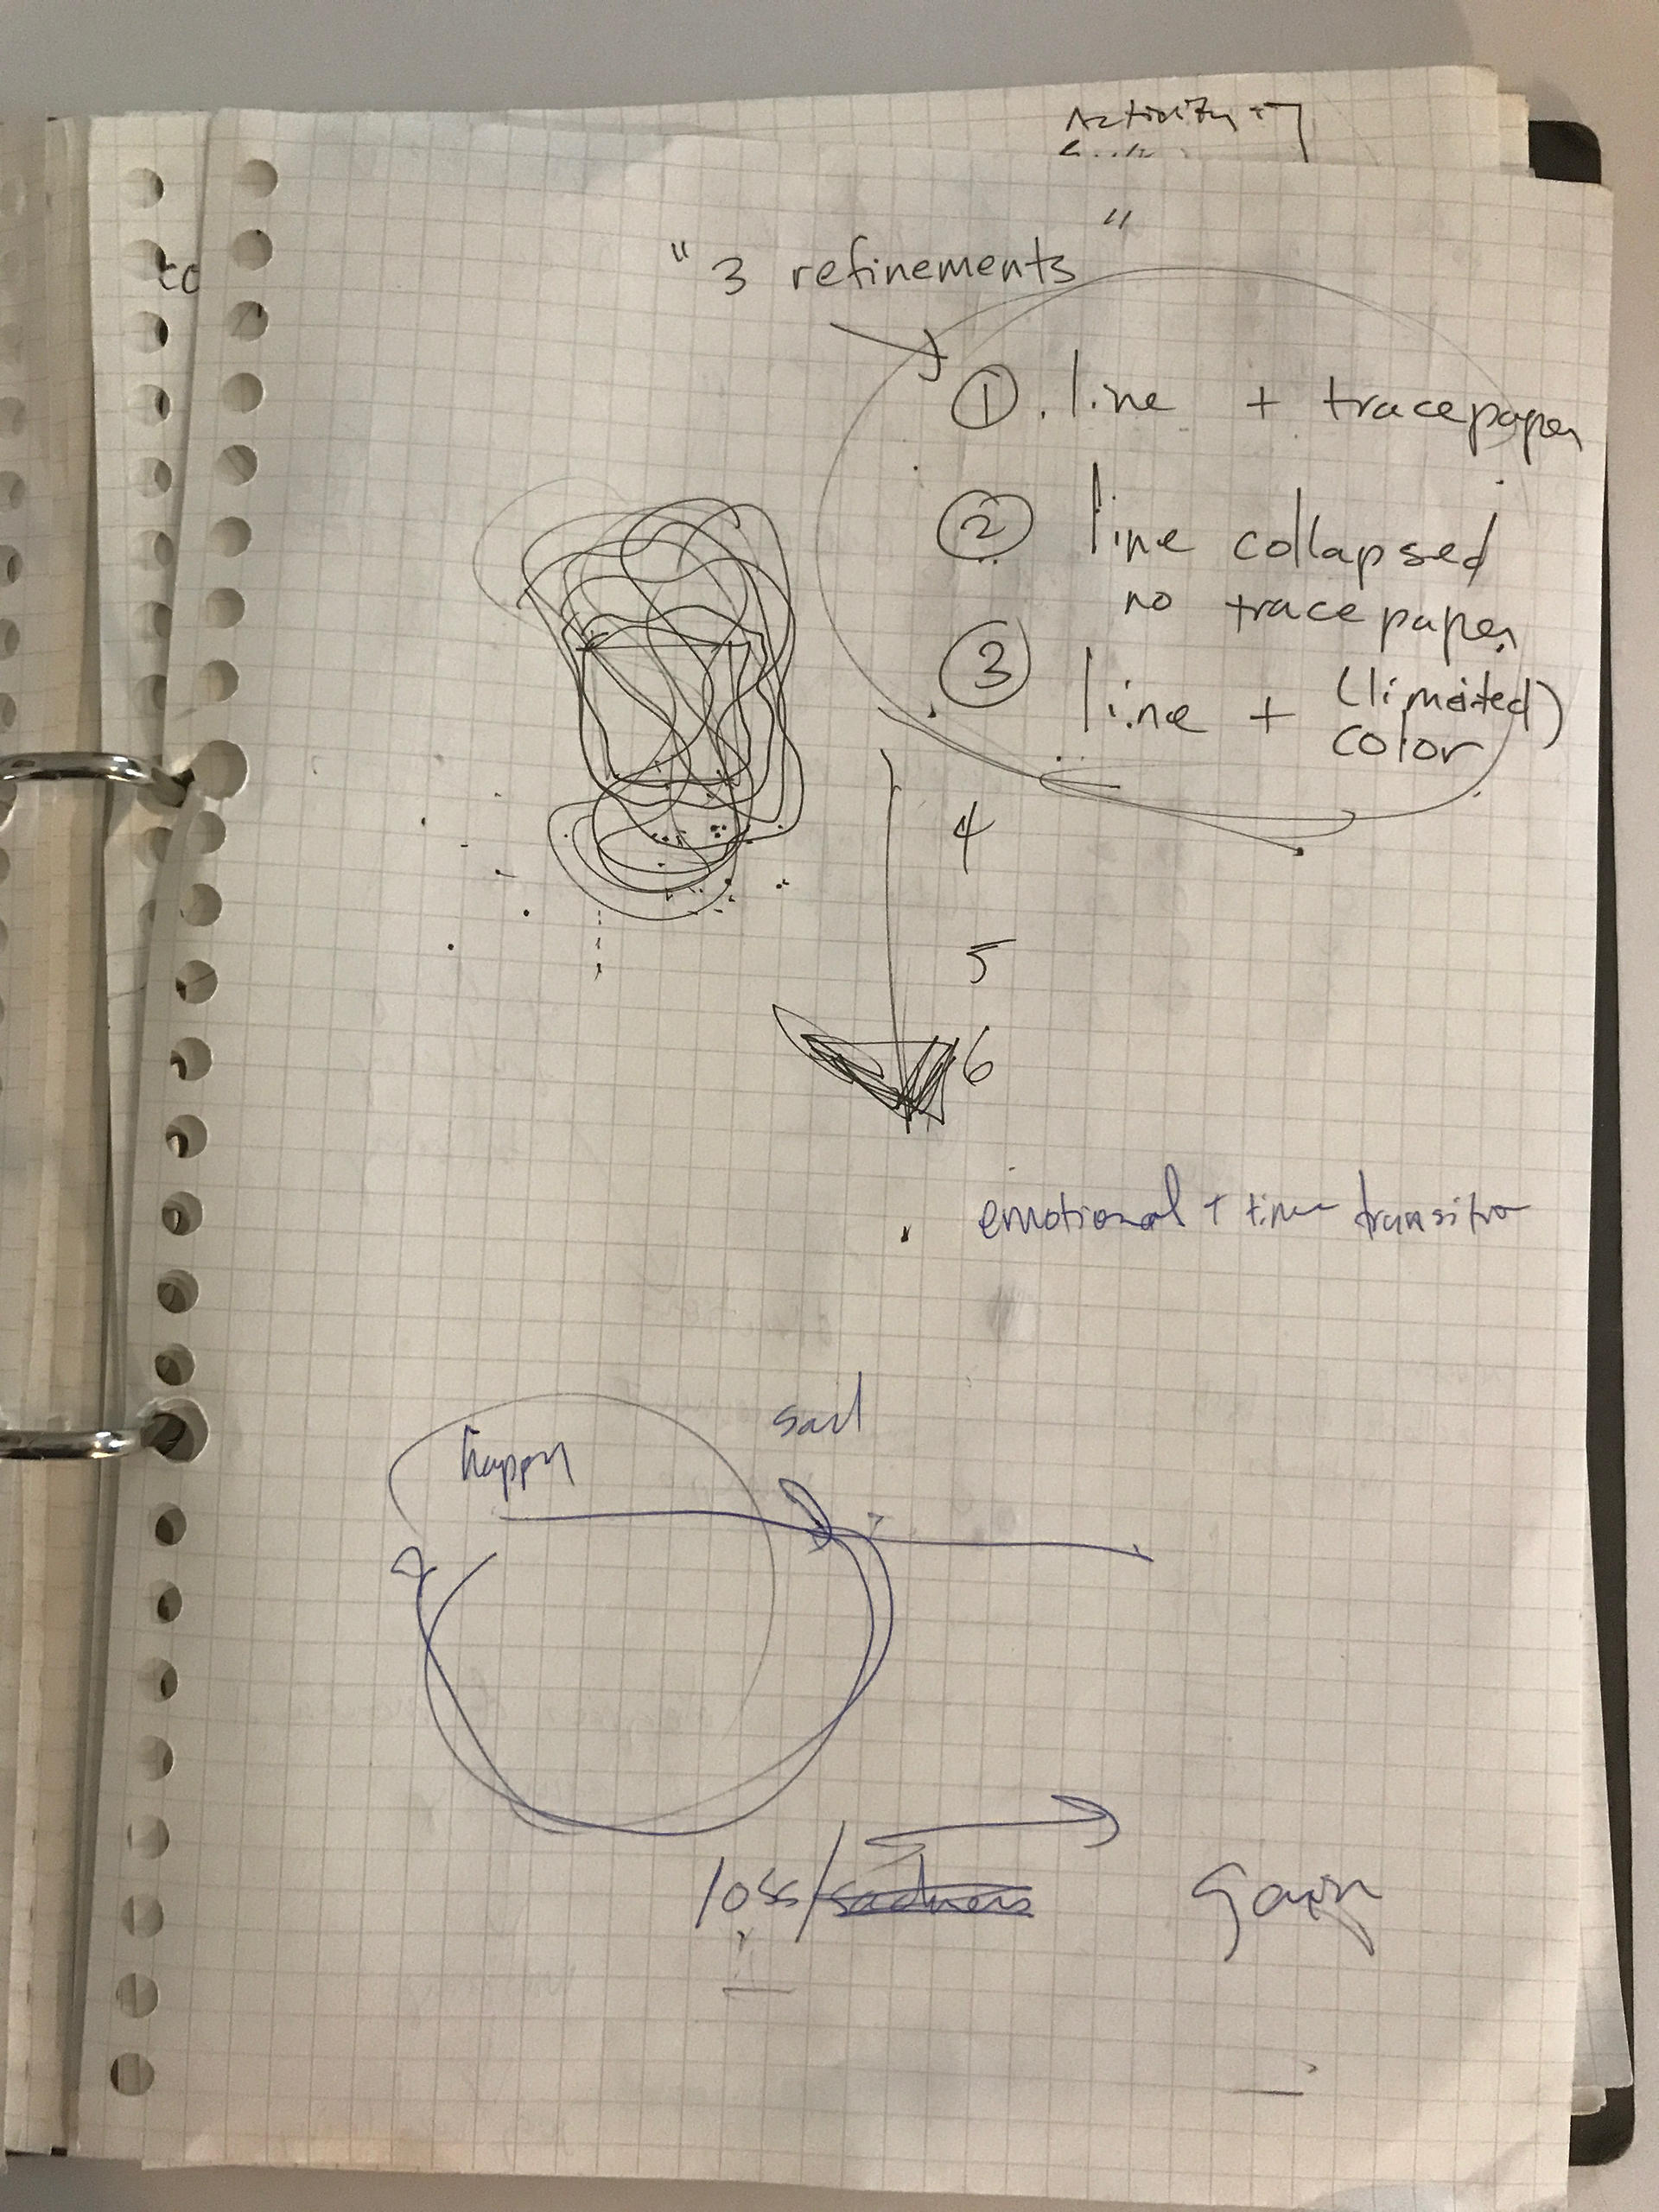
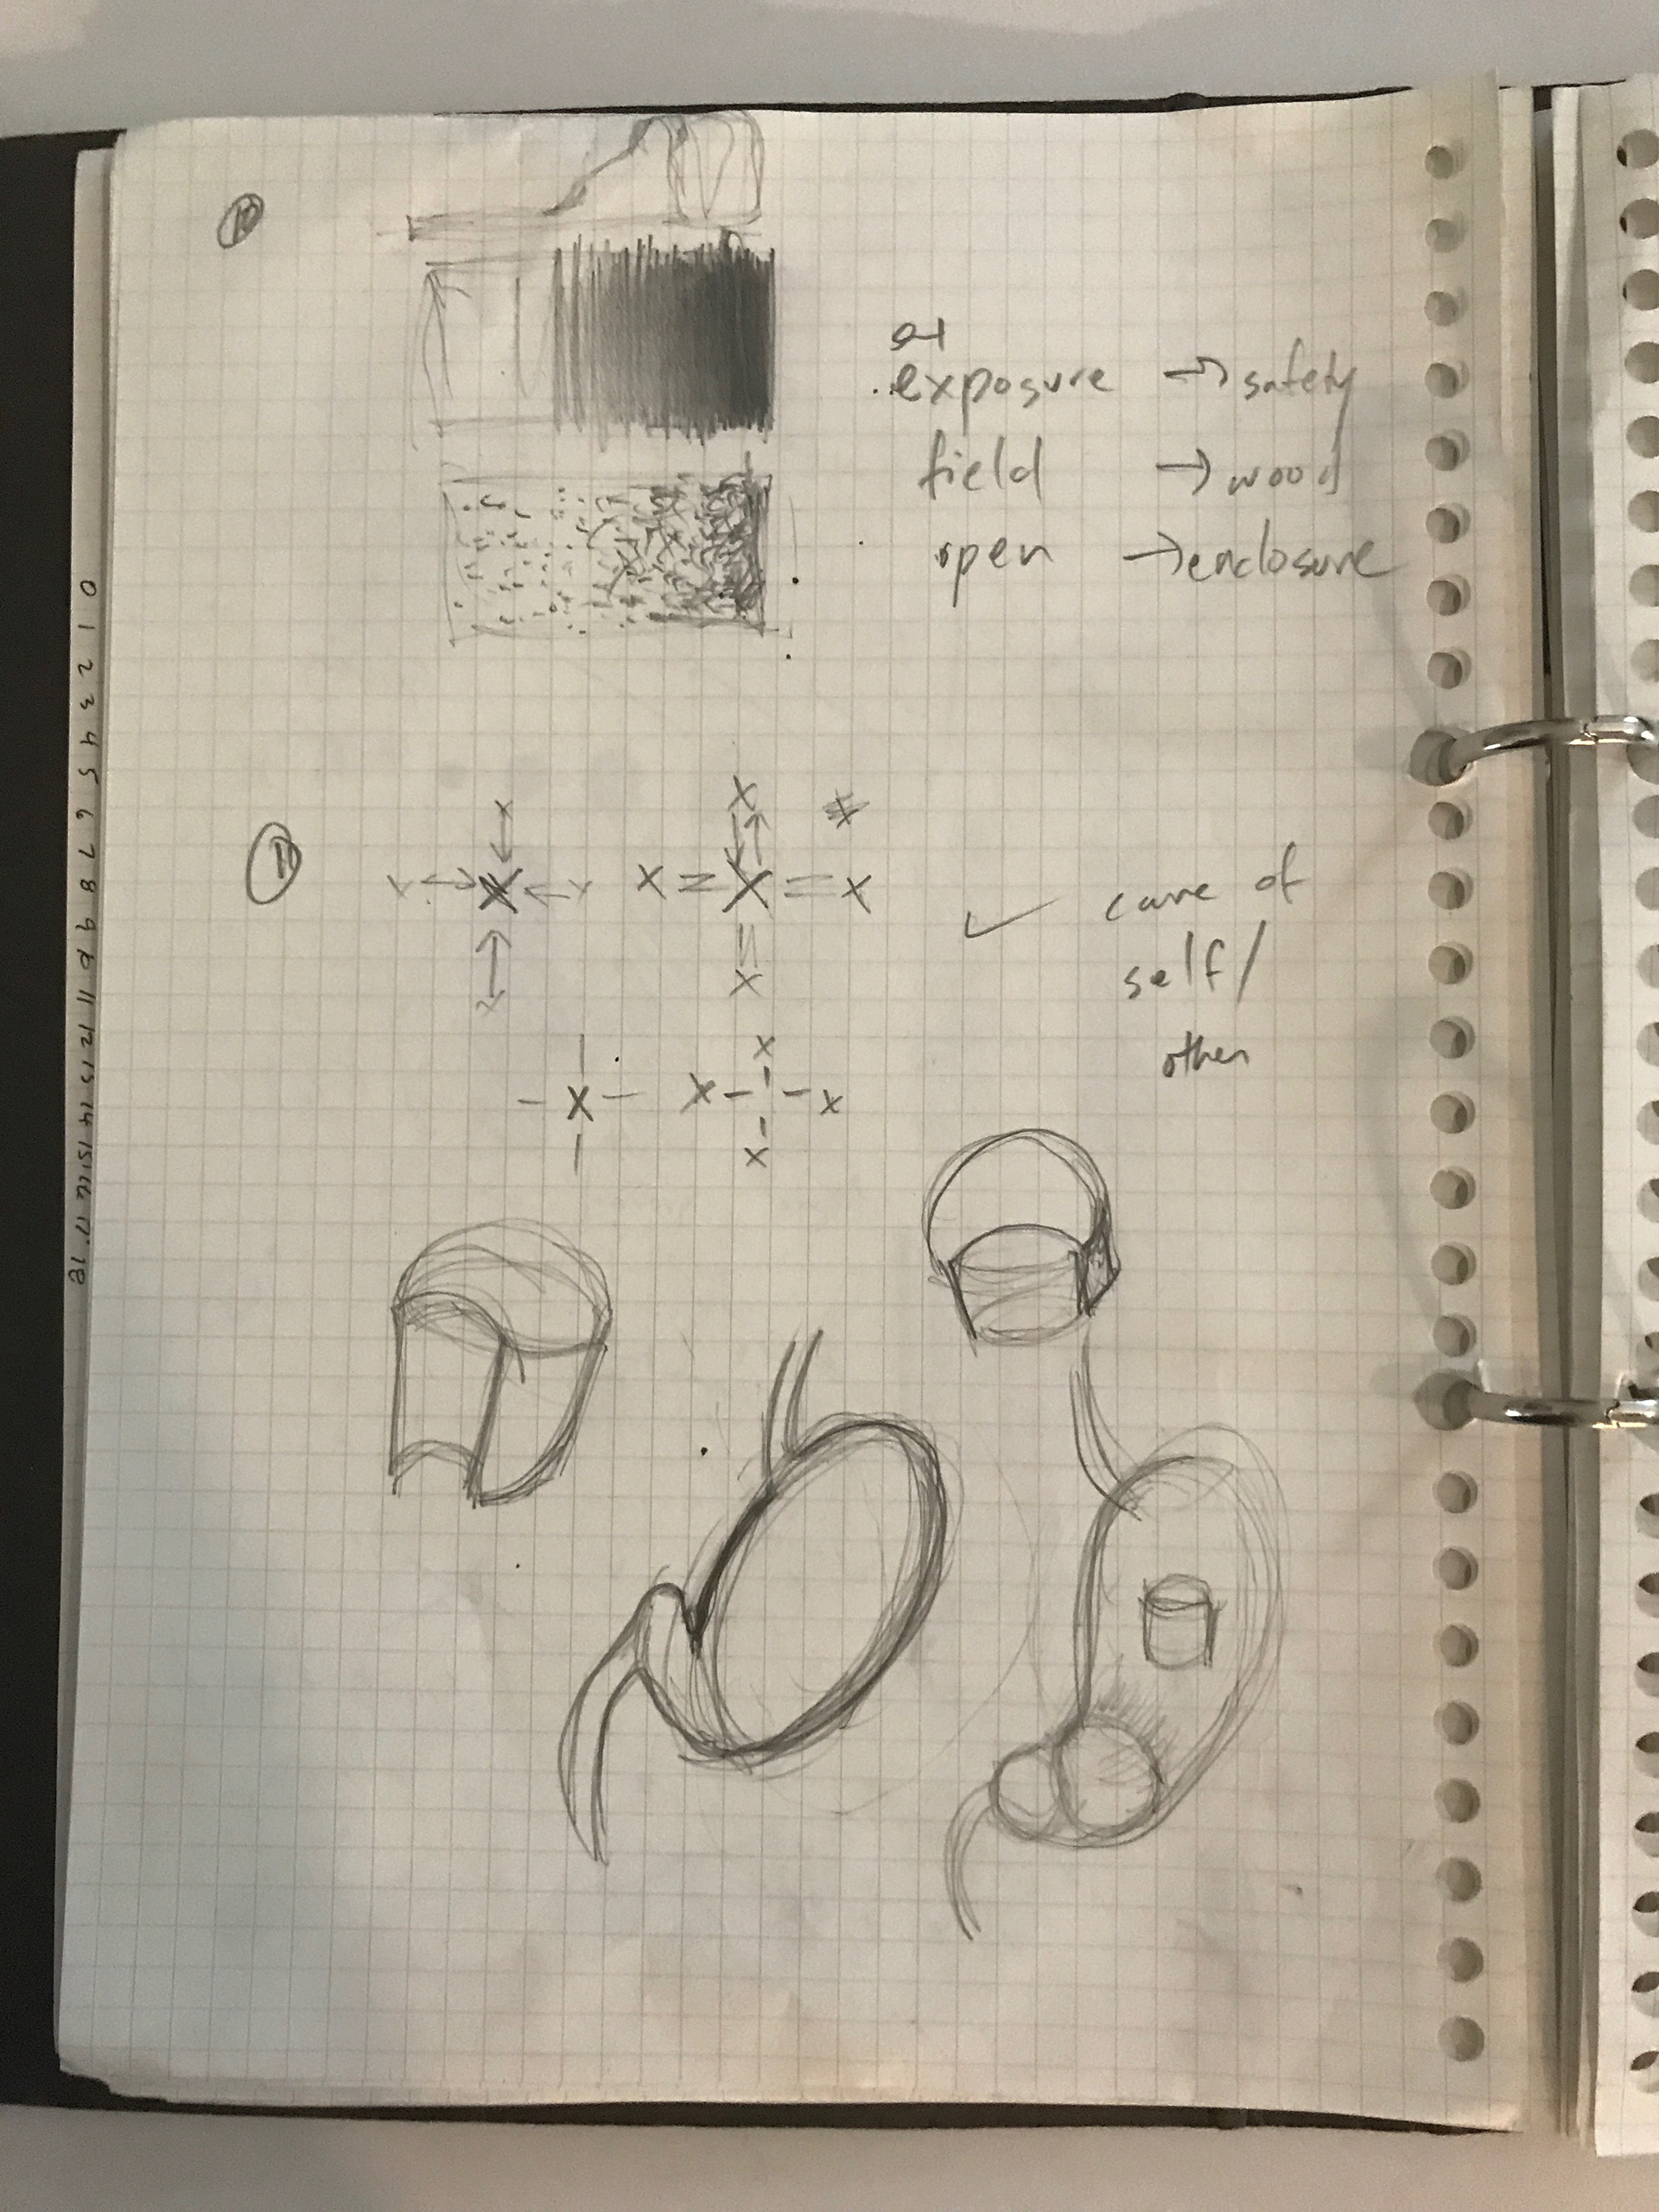
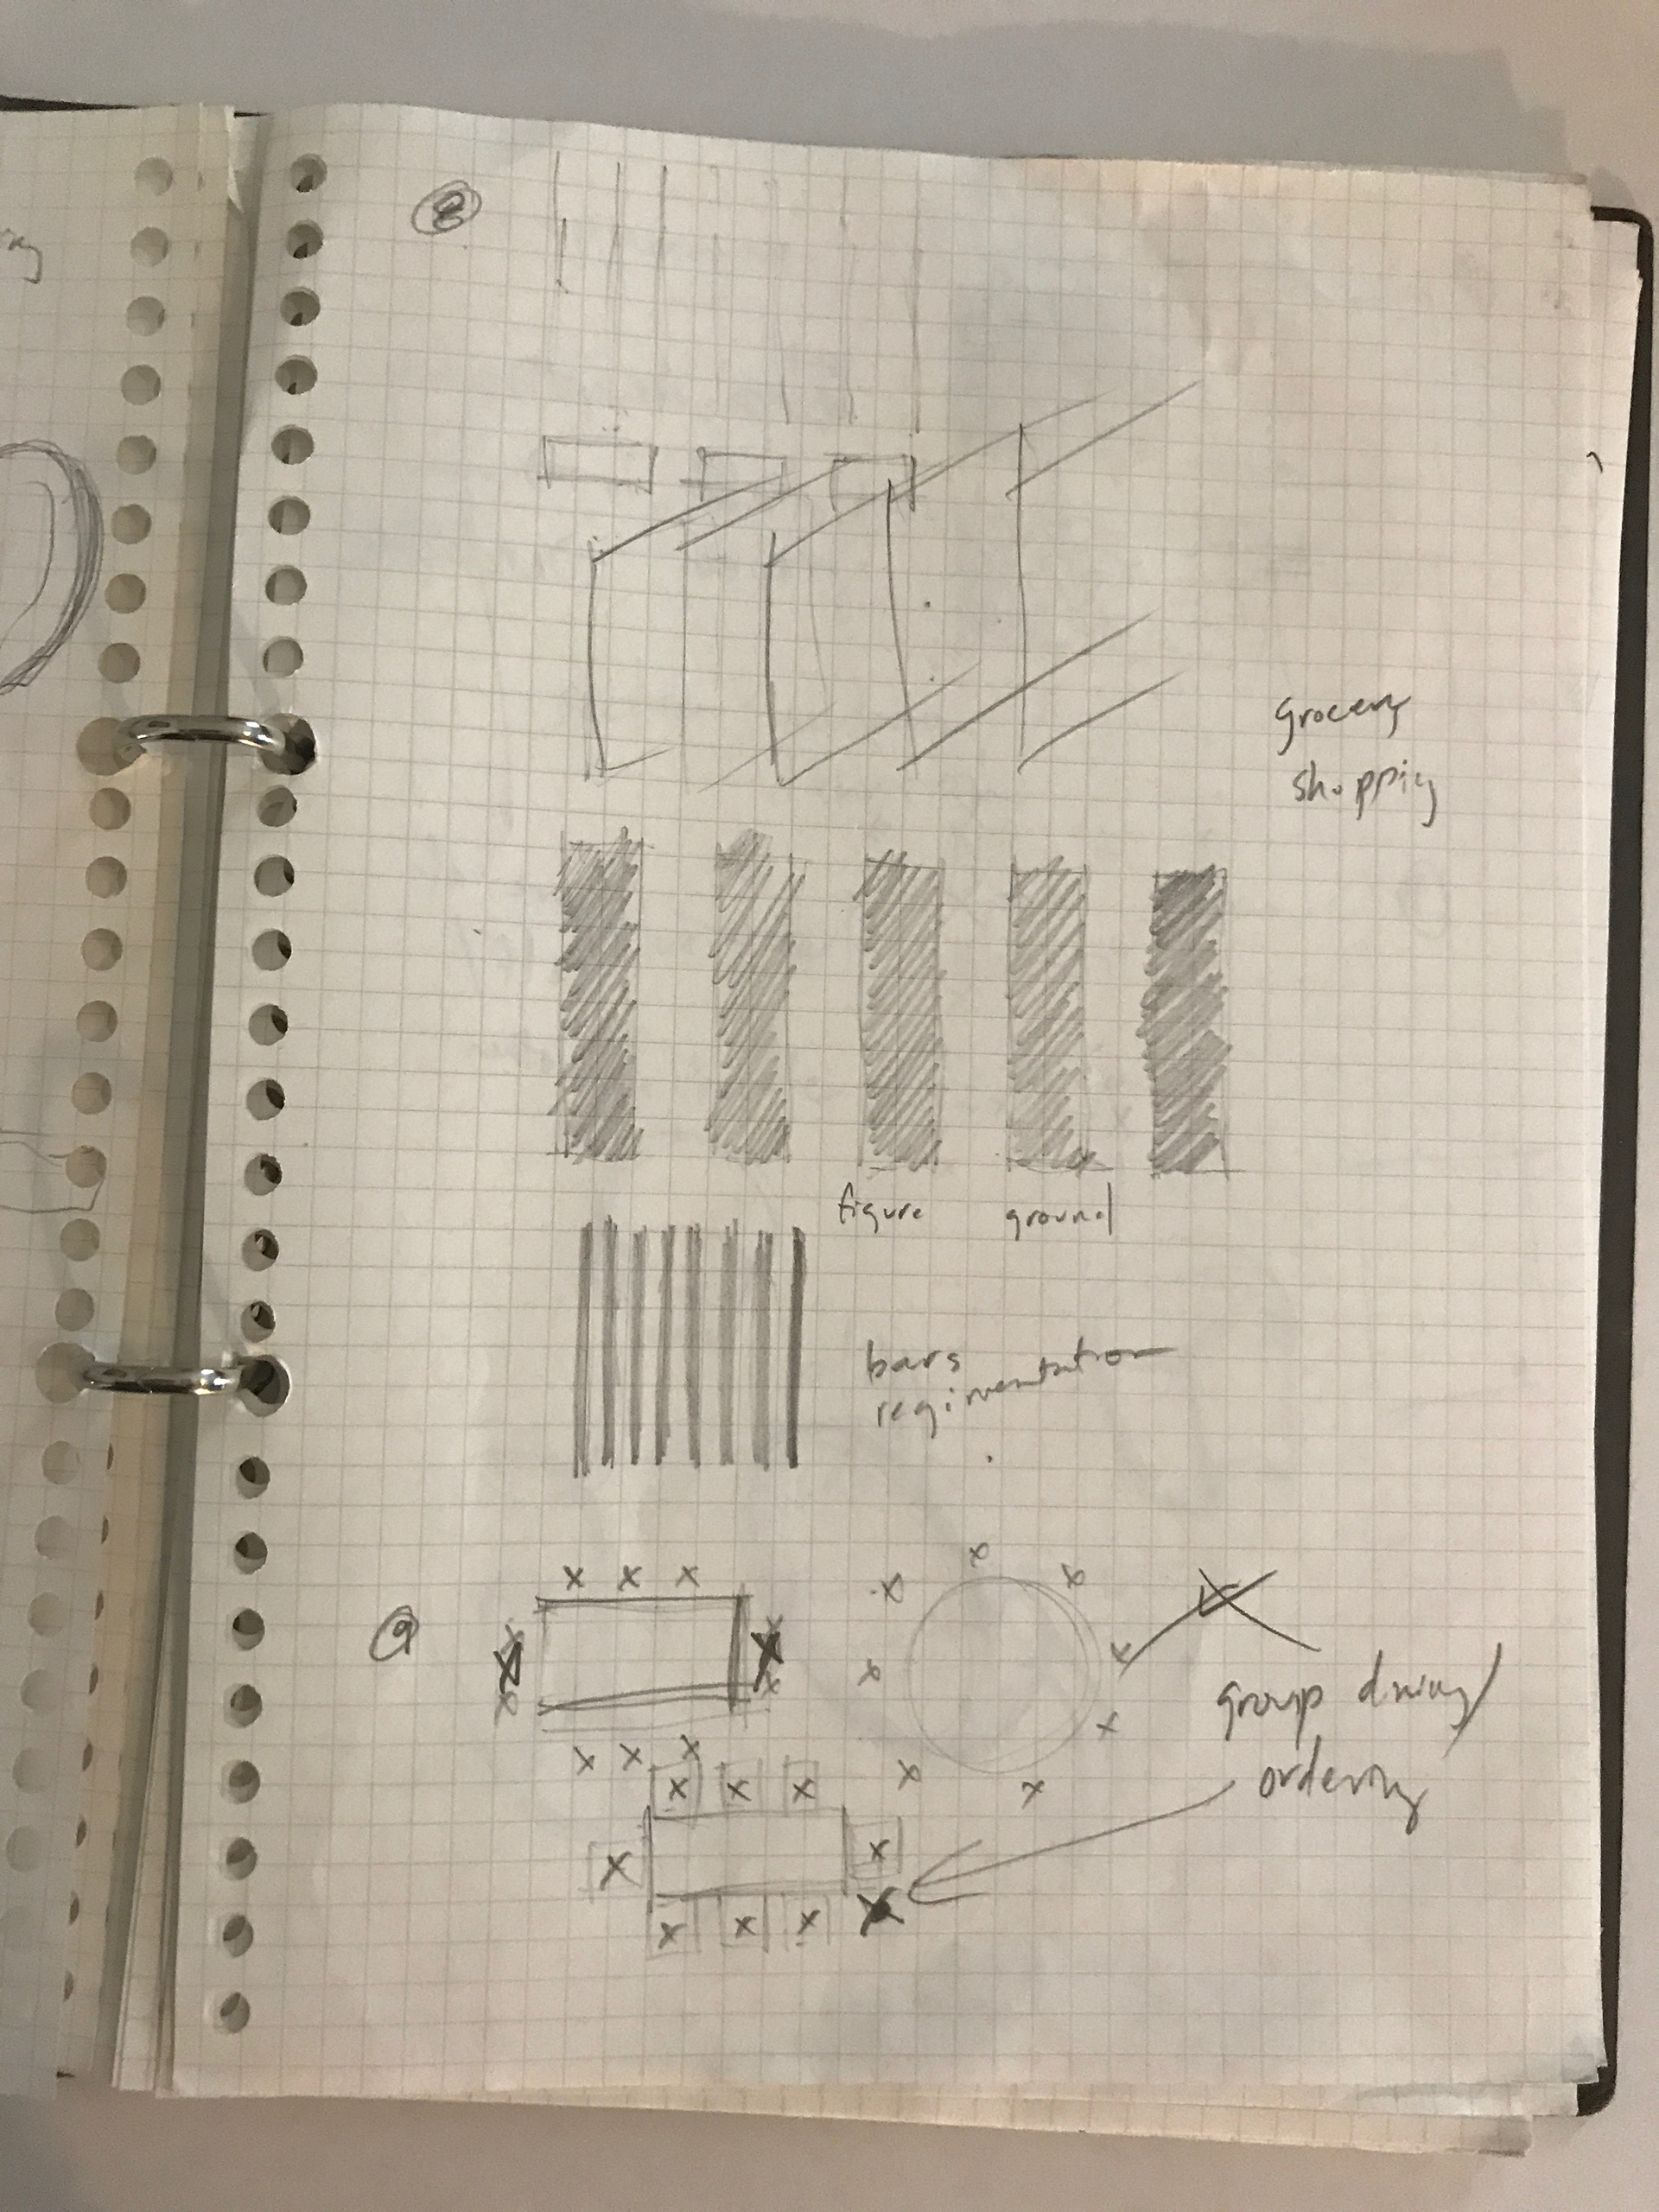
Process stage 1, Katherine Bennett, notes and sketches.
Ideation, sketches and team notes. We arrived at food as a map-able, transformative site through a process of individual and team brainstorming. We each brought to the table ideas about potential transitions and border-crossings that could be mapped. After compiling and refining a group list of possibilities, we each sketched 10+ potential map ideas based on our list. Photos of team notes and my own sketch and note -books are above. Our compiled list is here [https://www.dropbox.com/s/2de06zo88m4yn3u/Ideas_group_18-8-29.docx?dl=0]
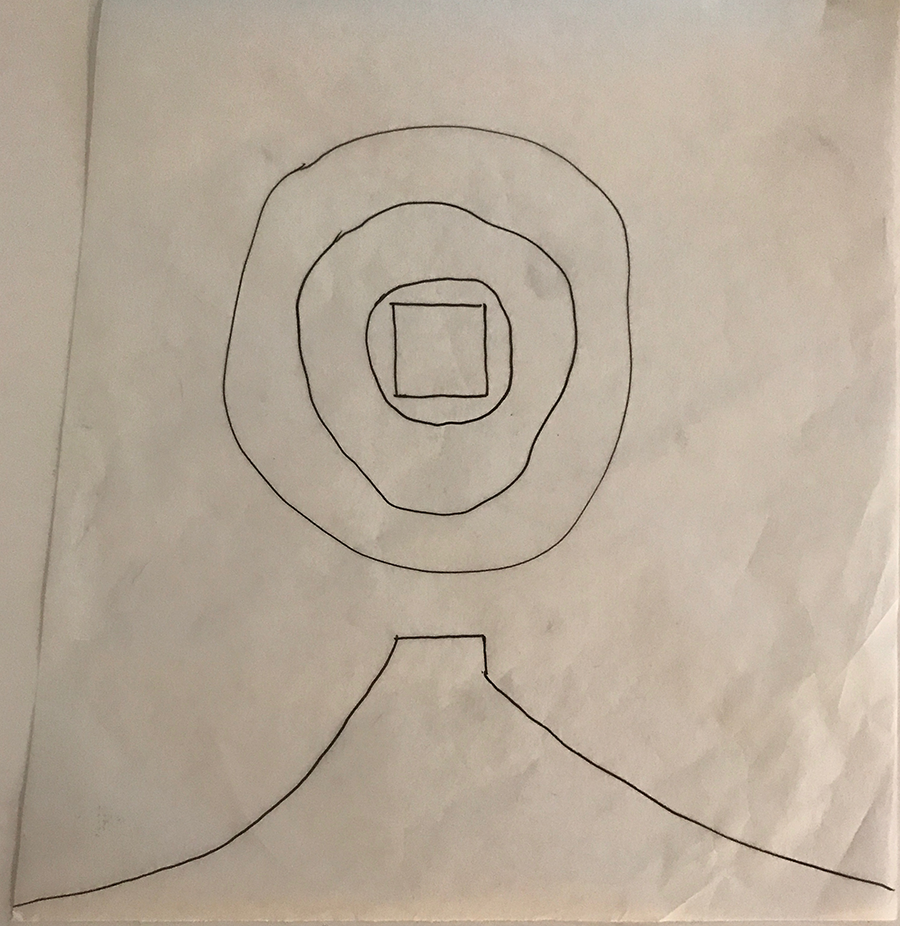
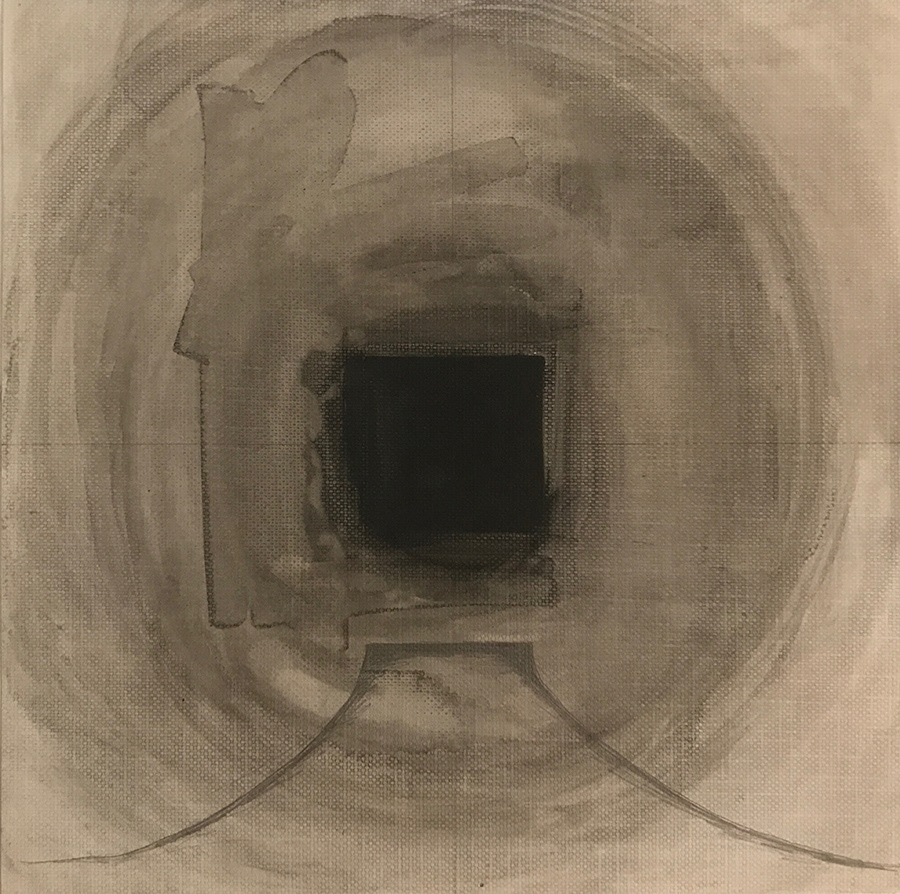
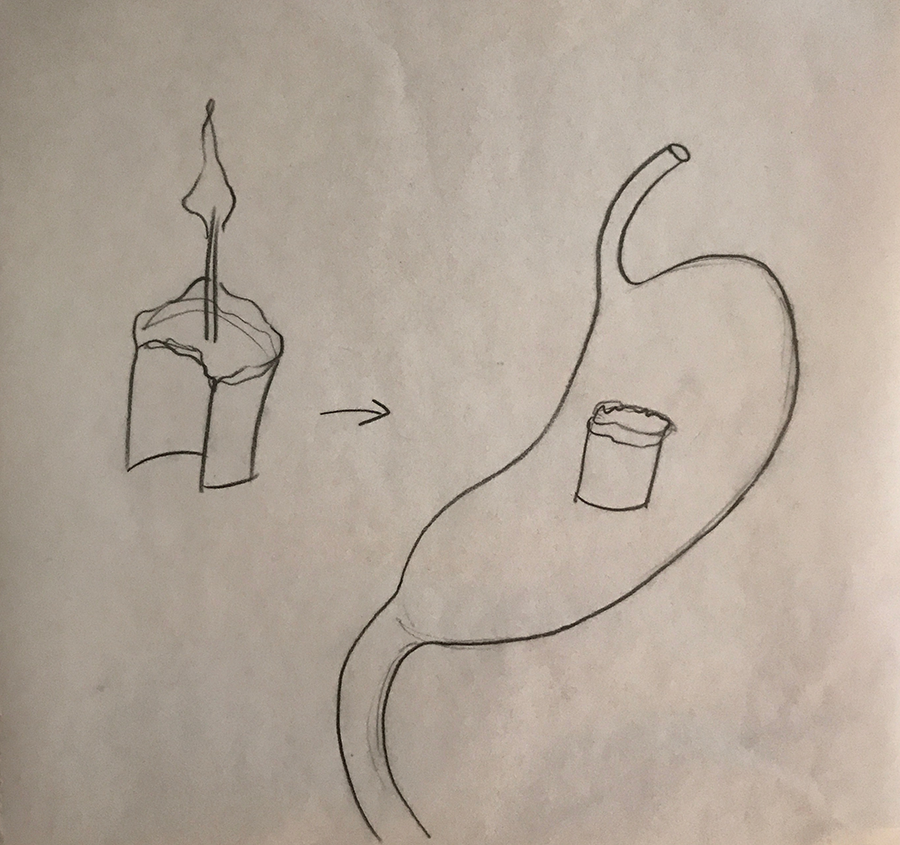
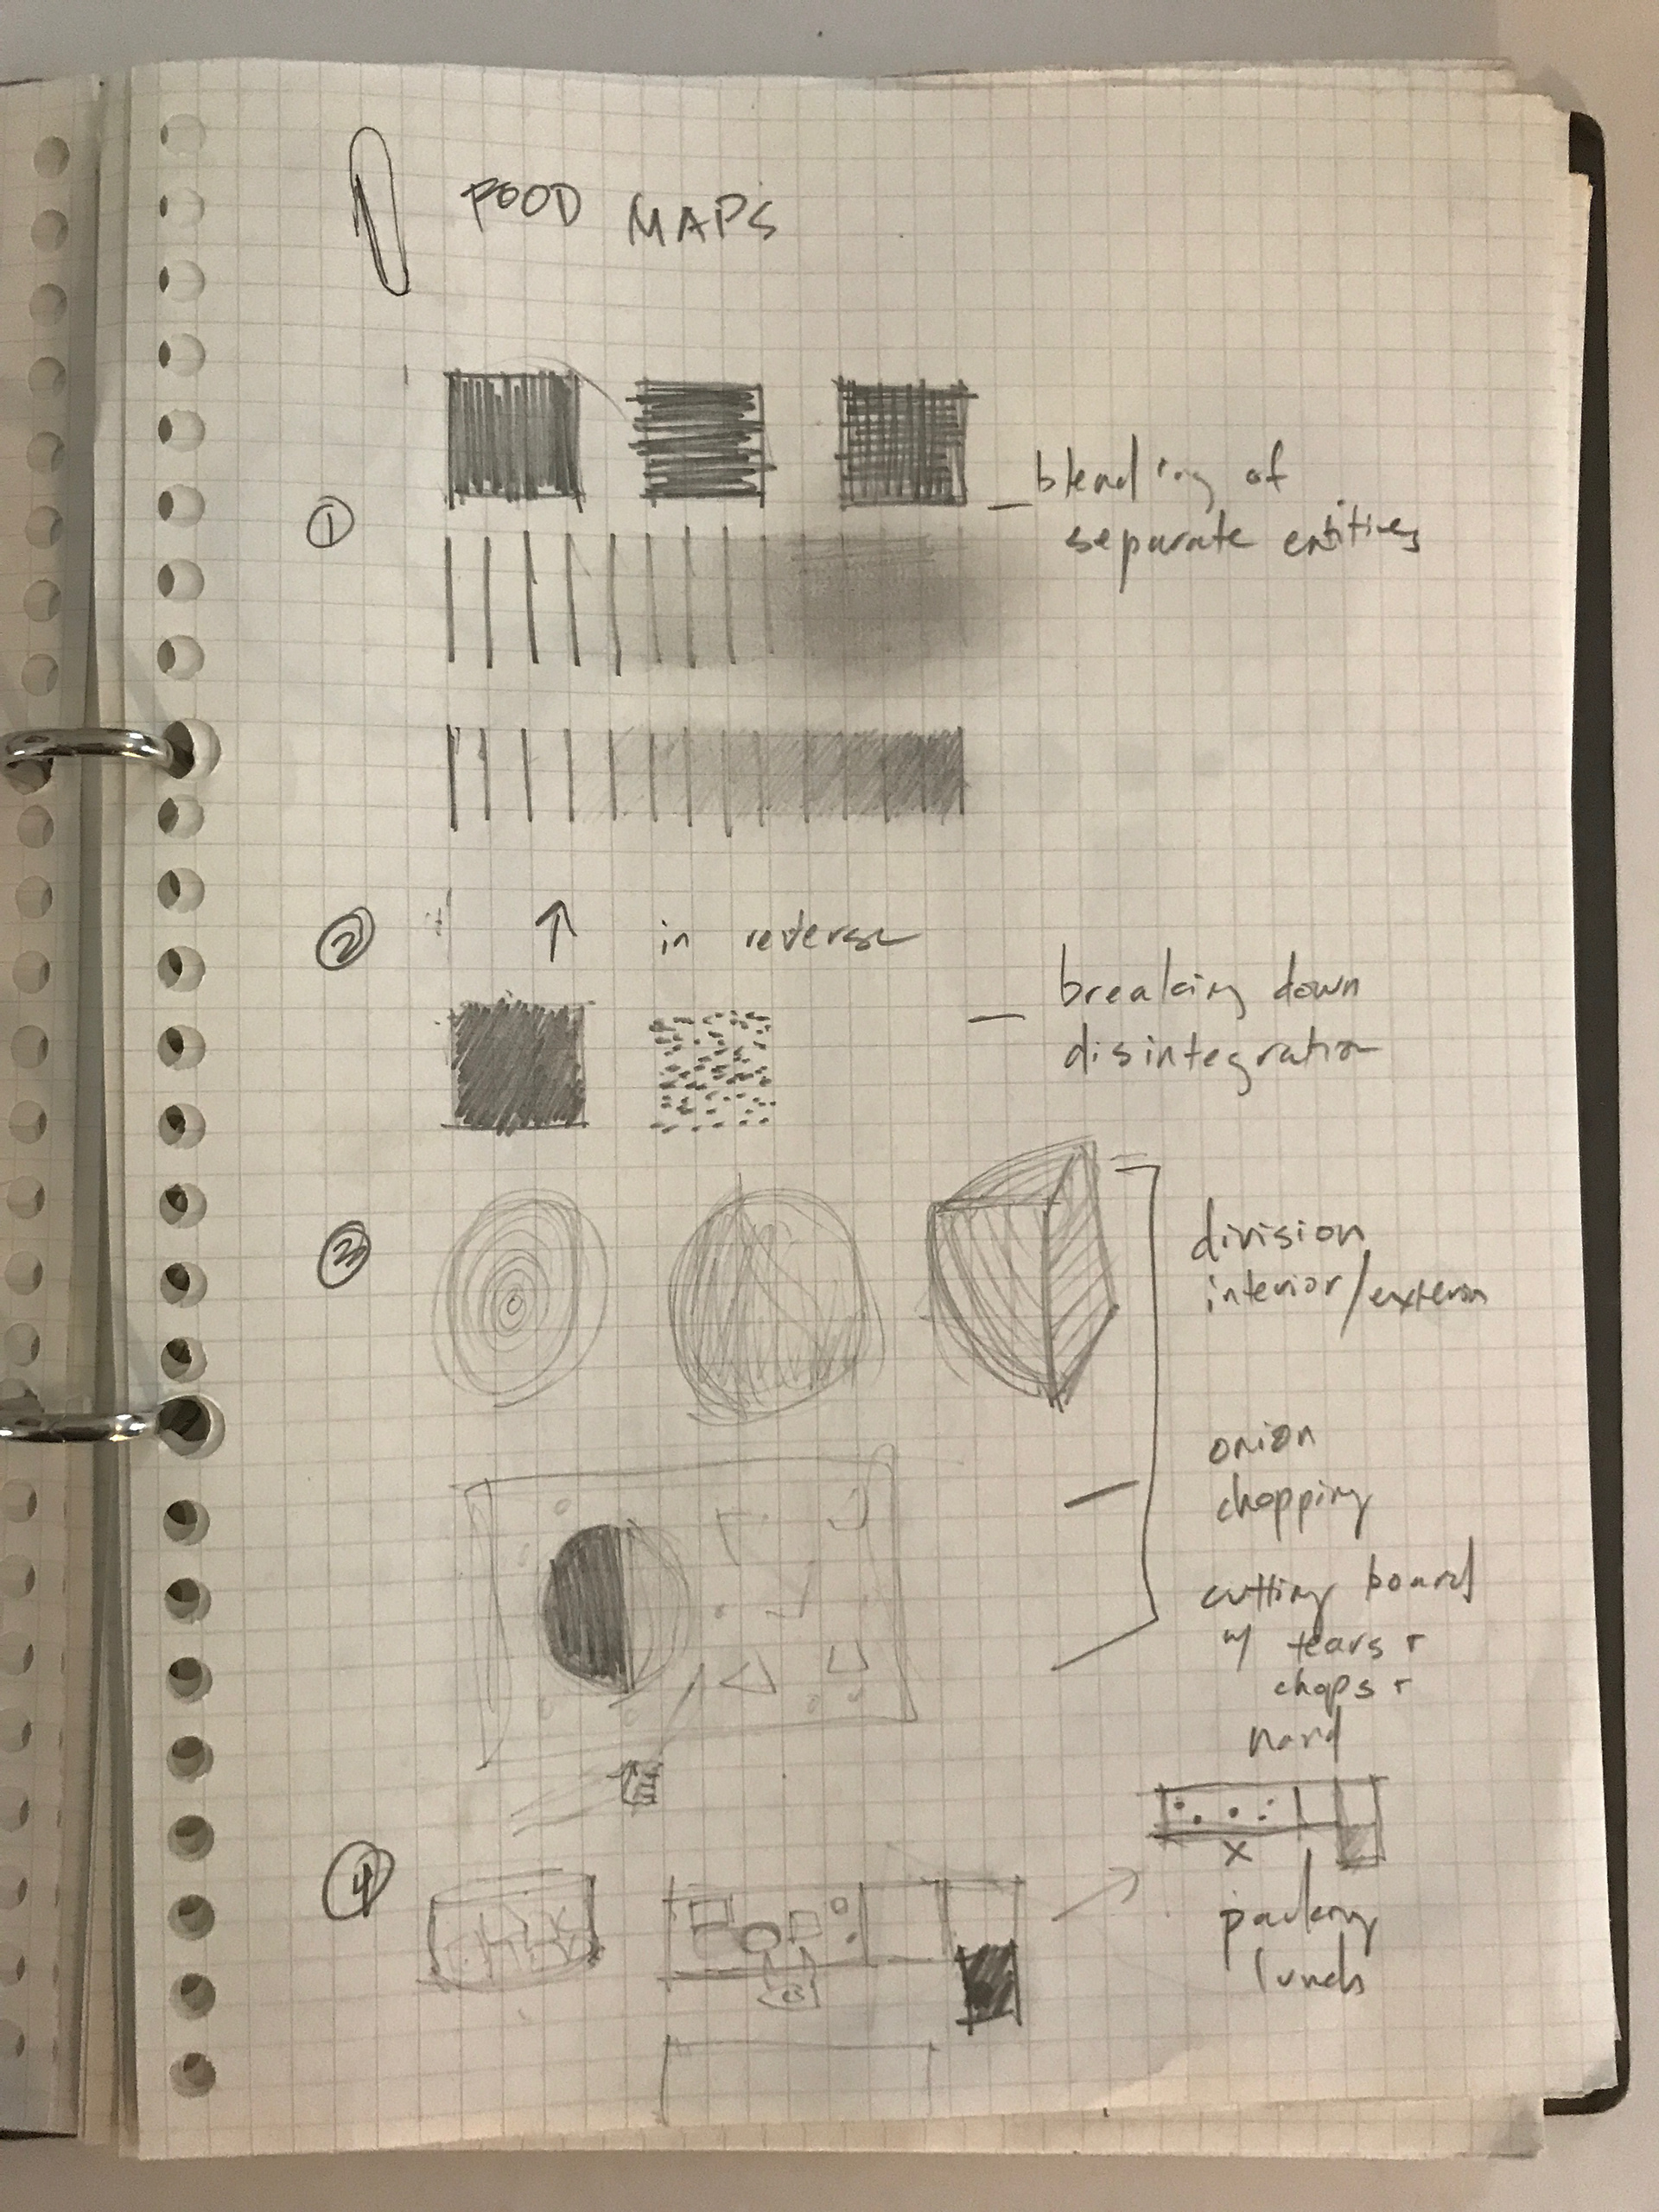
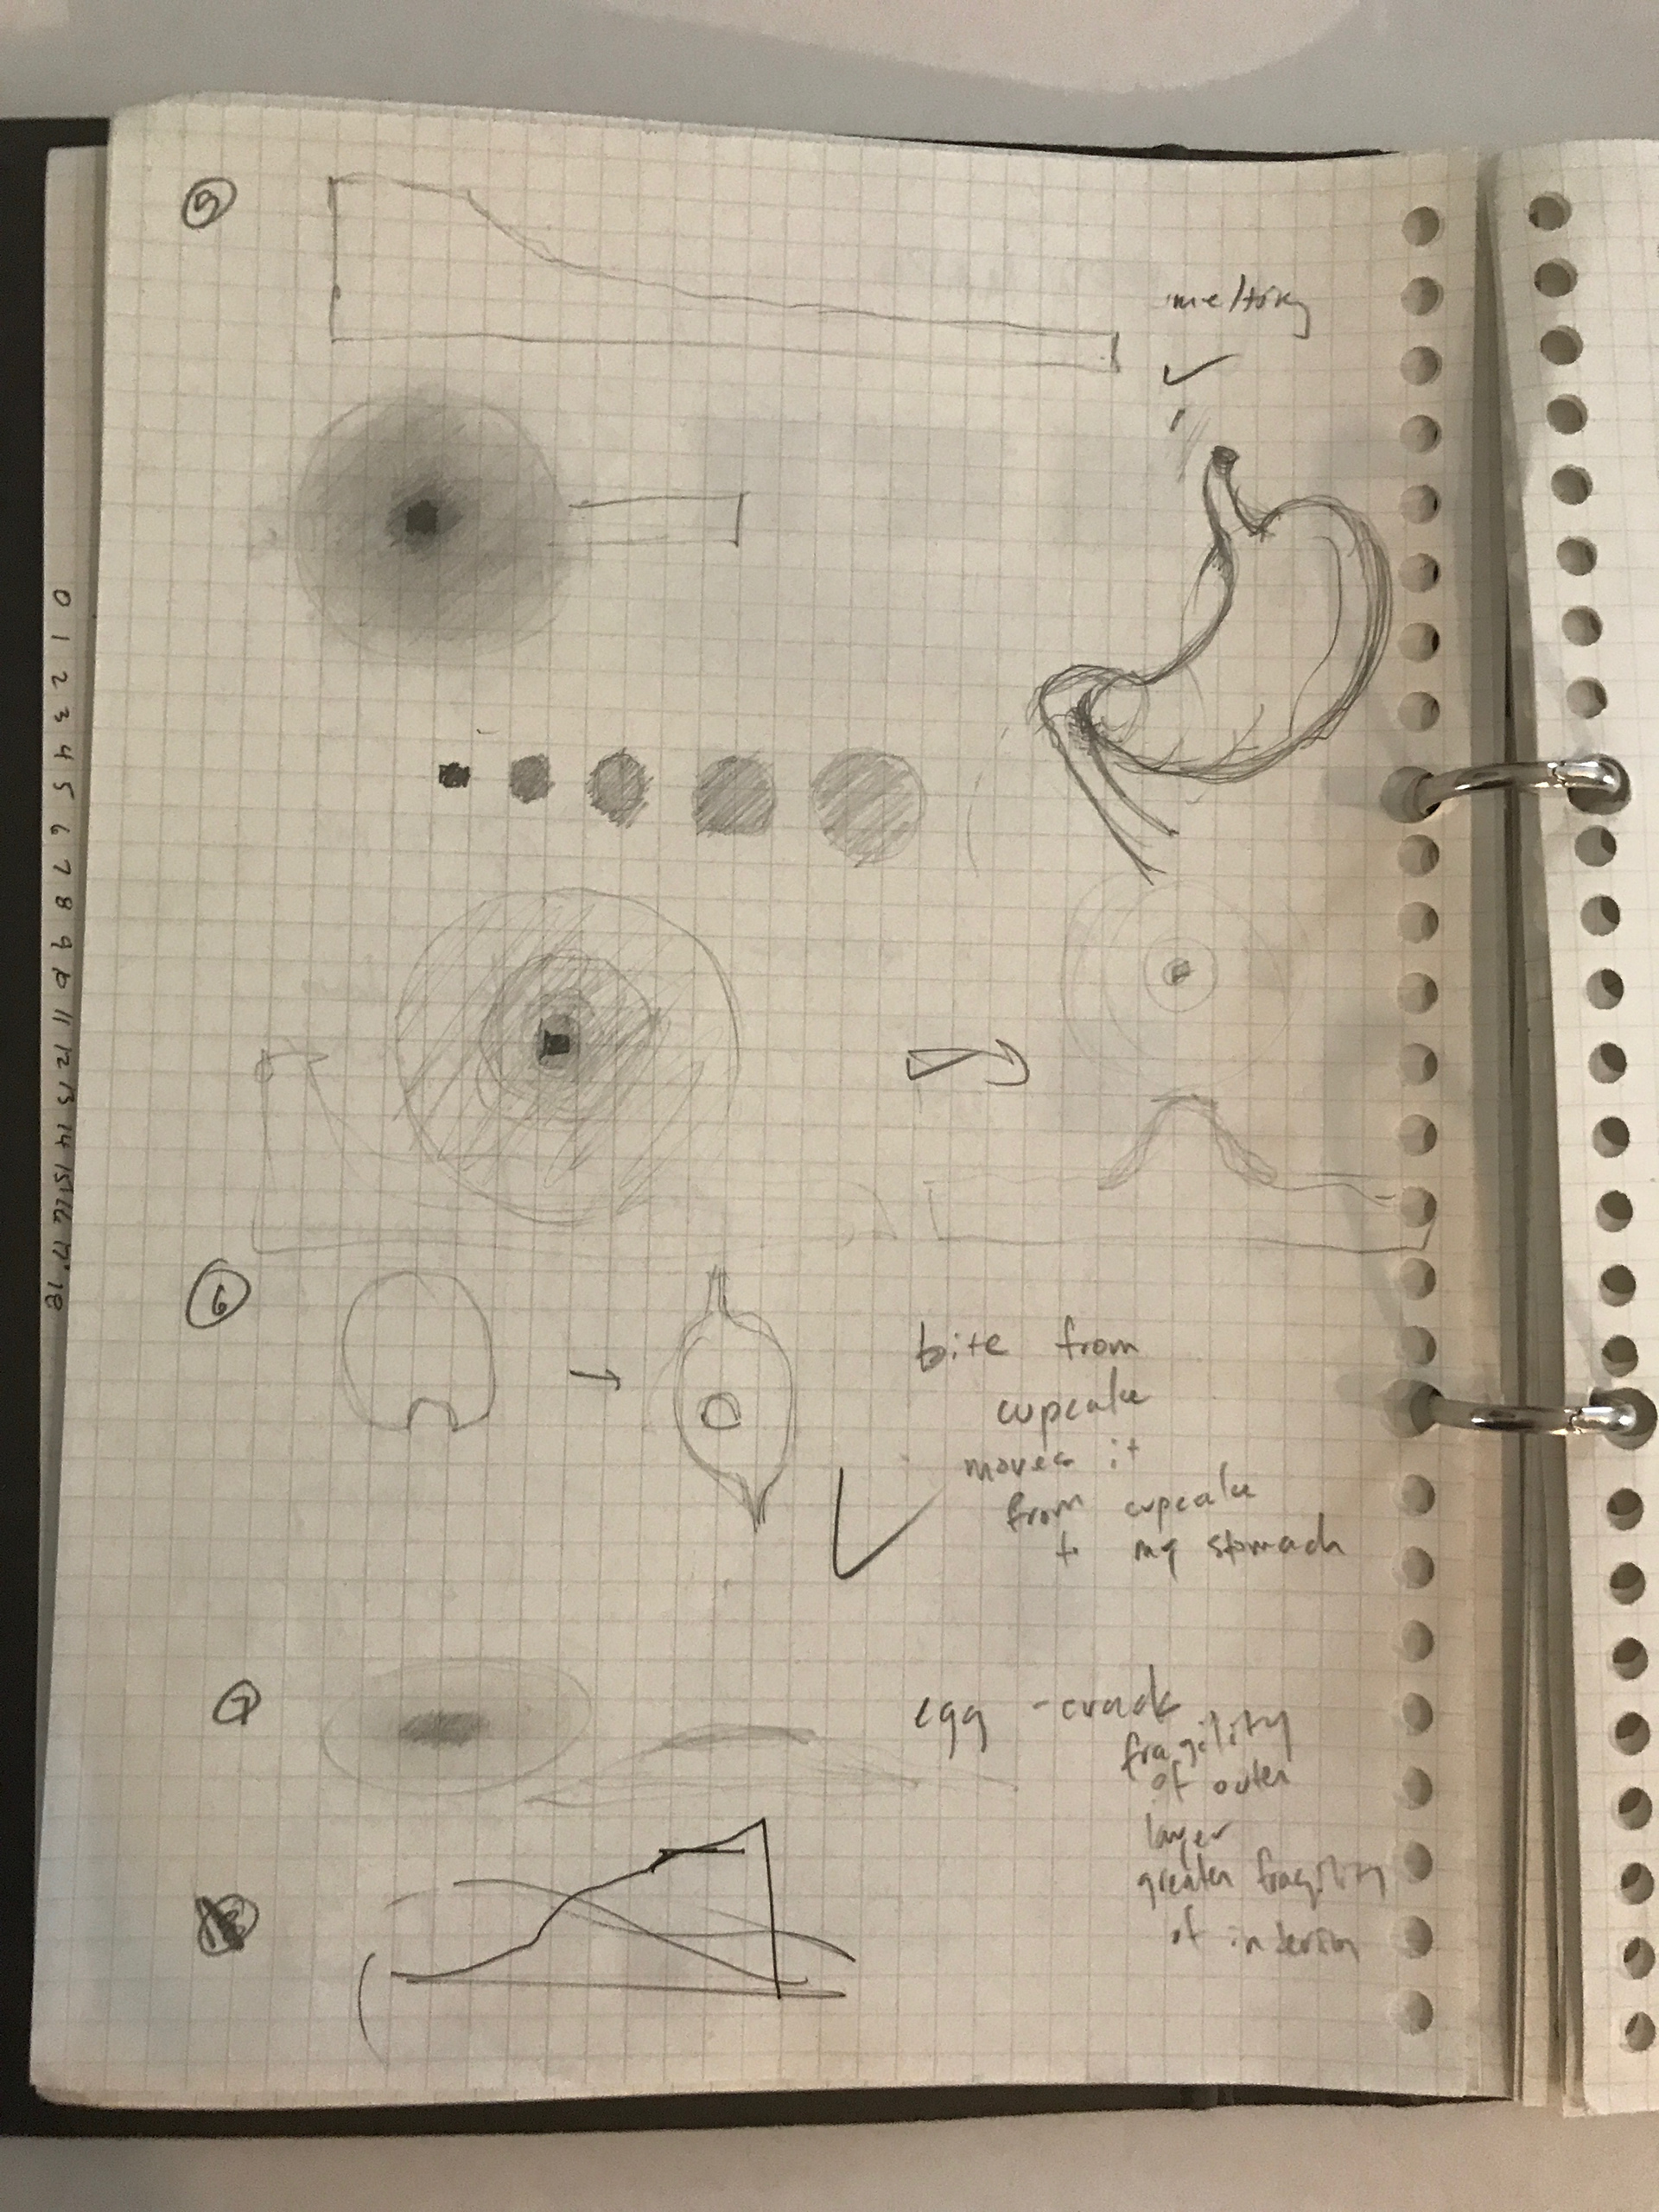
Process stage 2, Katherine Bennett, drawing tests. Hand-drawn explorations of different mapping ideas.
Refinement and development, drawings and critique. Based on team discussions, we each drafted three map ideas for a class pin-up in week 2. My draft maps, above, include: (1-2 from left) a mental image of butter melting (far left in pencil, center left in ink wash and pencil); (3) food as an act of caring for oneself and others (center right in ink and pencil; and (4) Christina's great idea of "no energy lost" in food consumption -- here envisioned as a cupcake inside and outside my stomach (far right, in pencil).
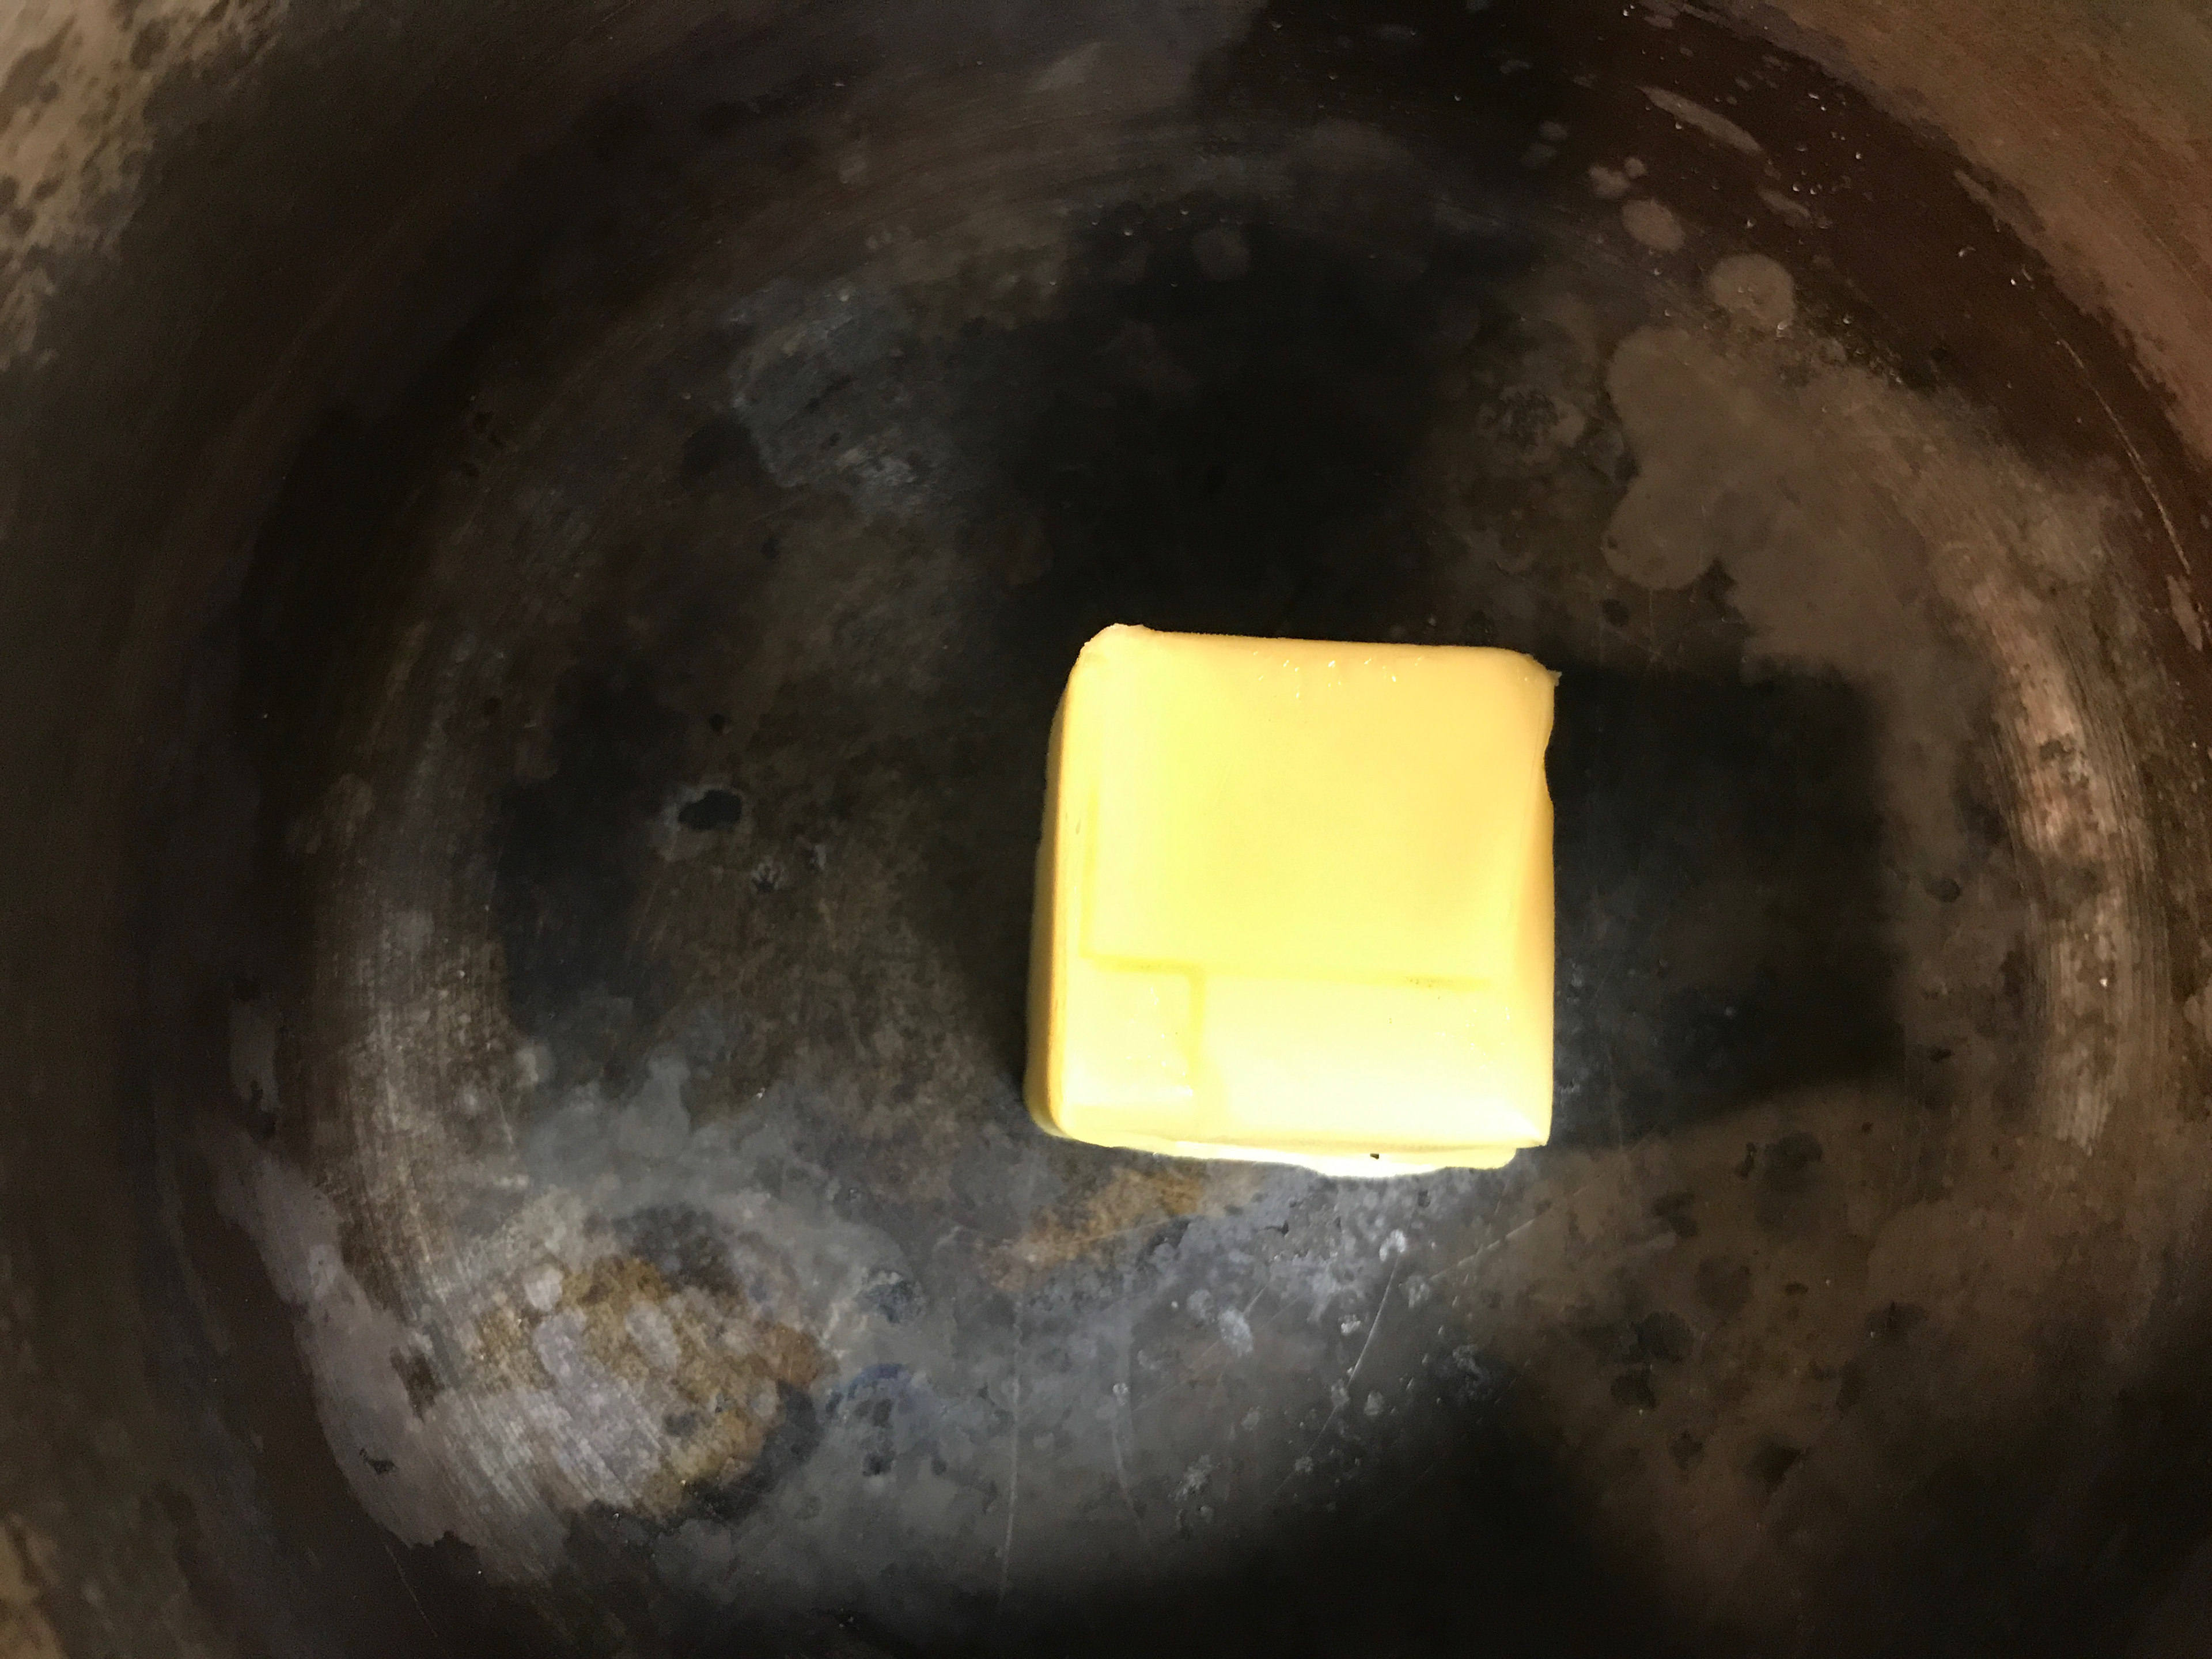
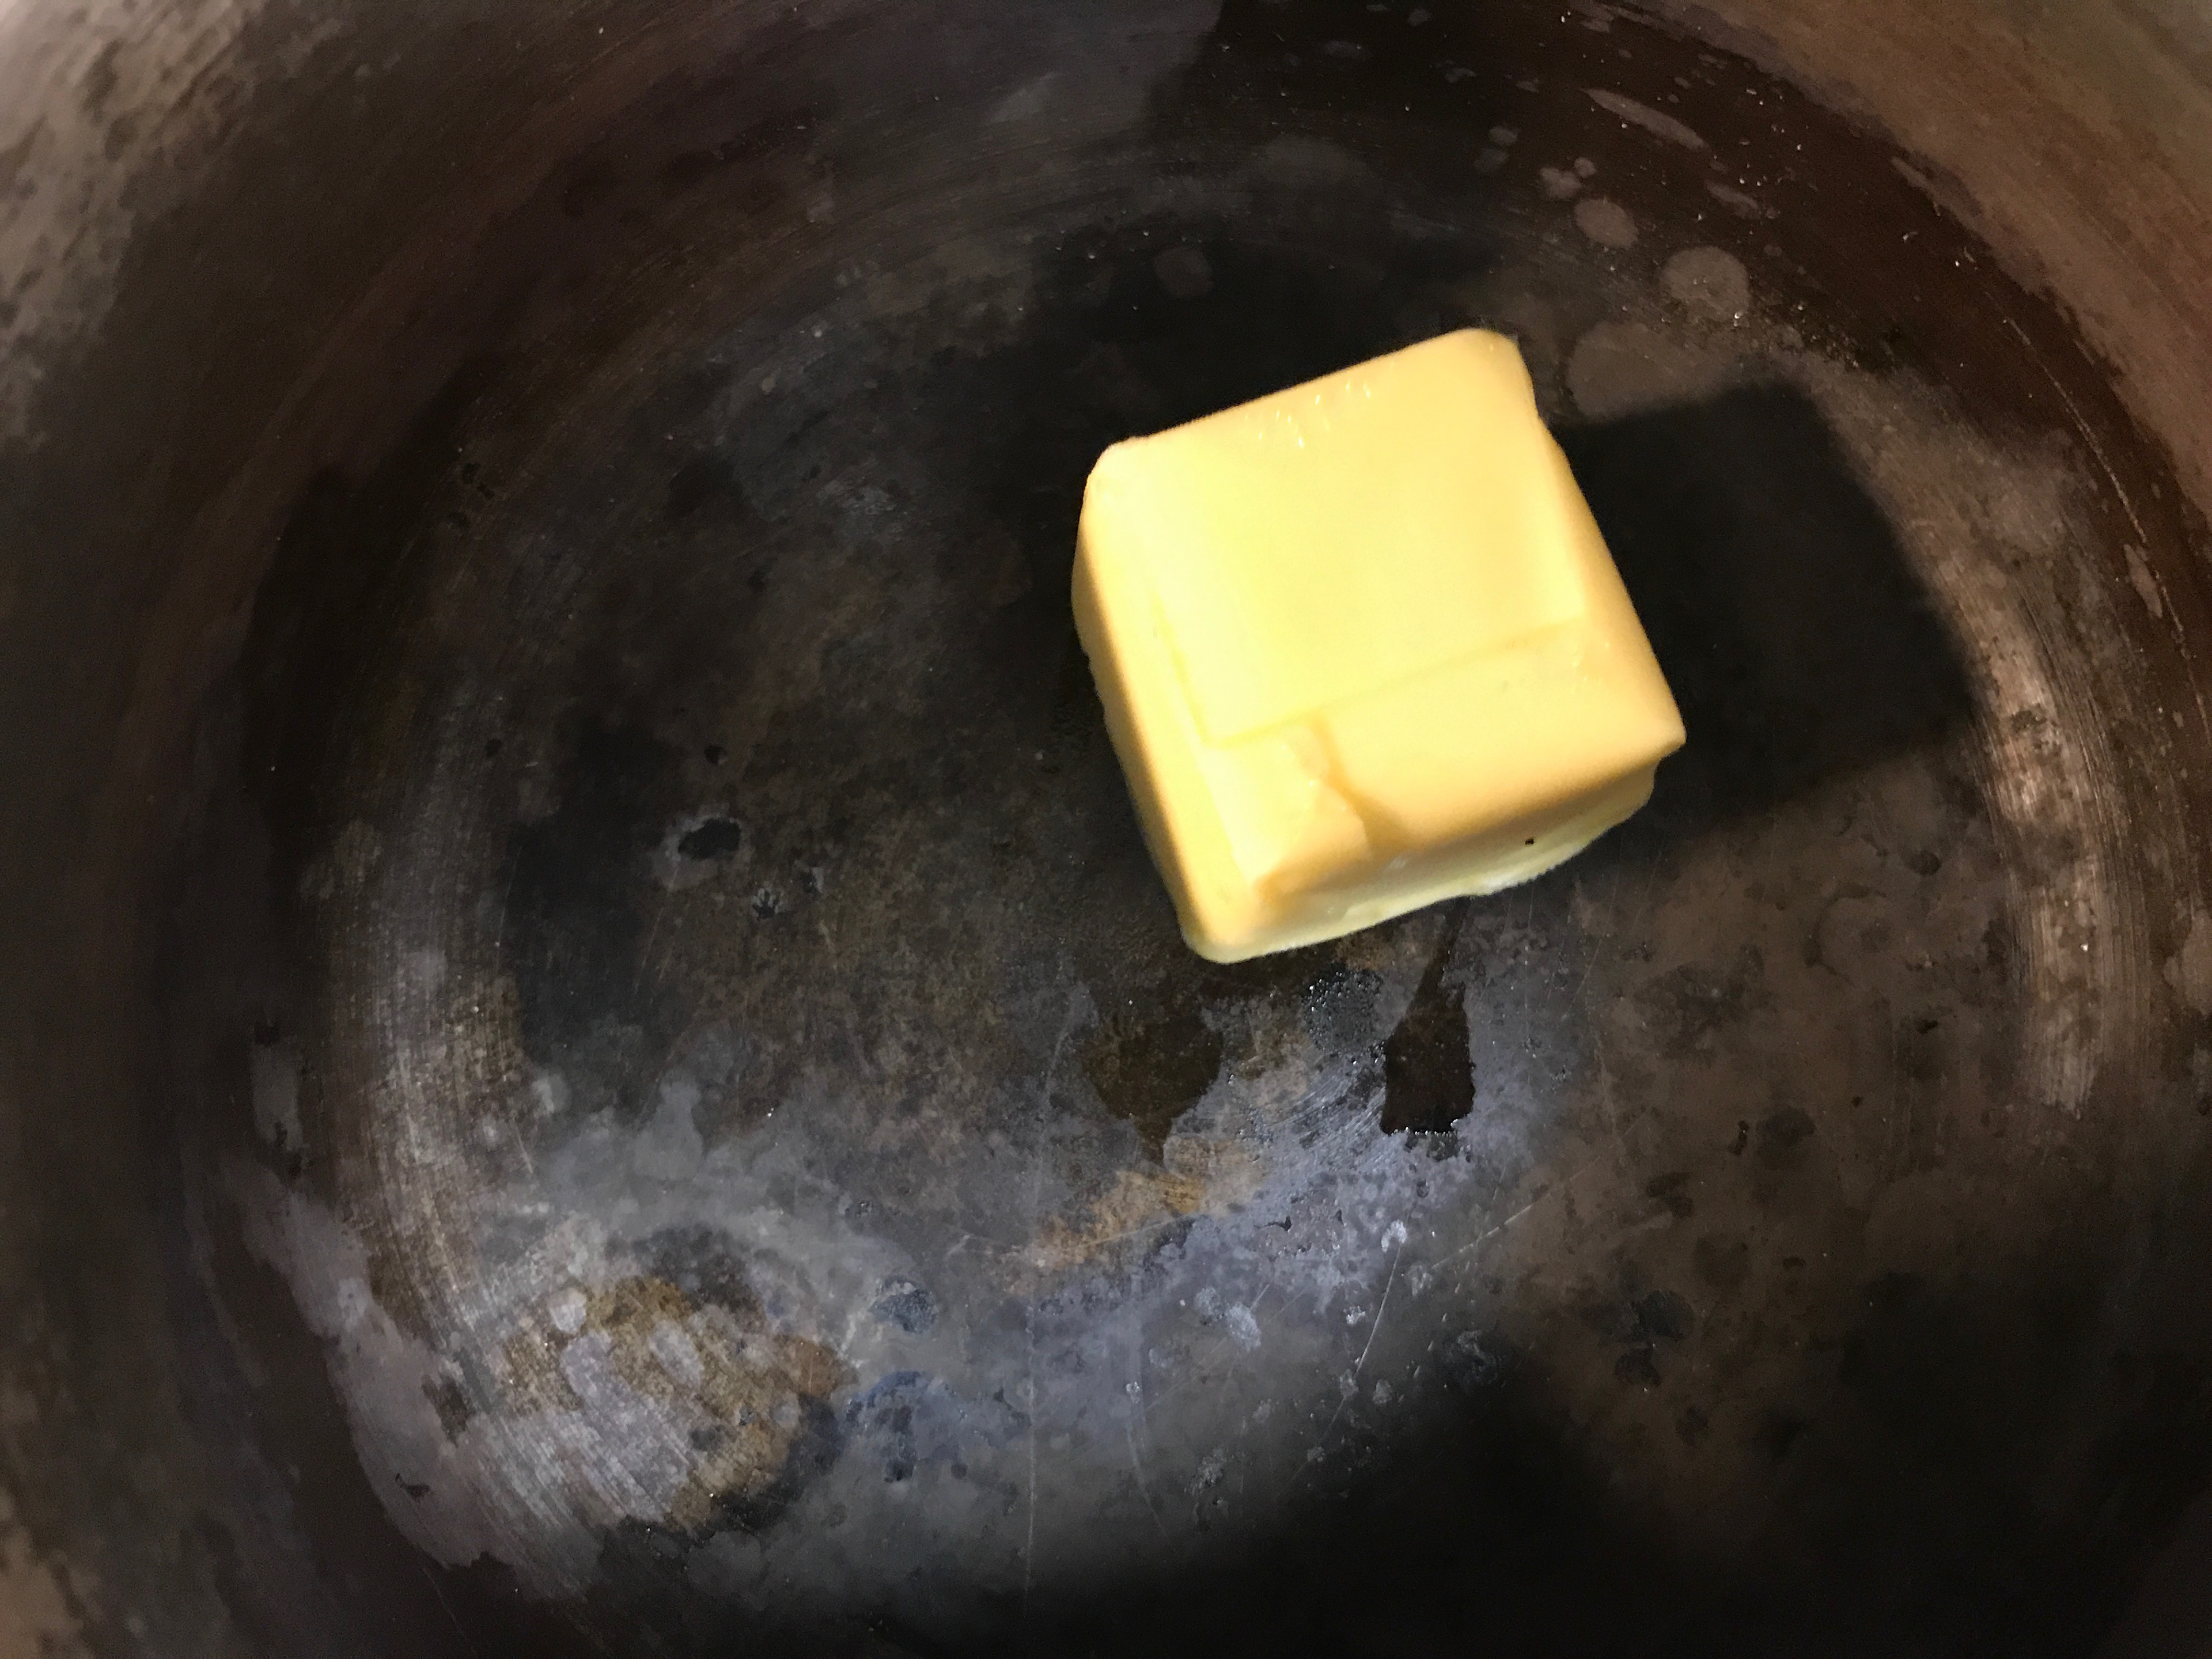
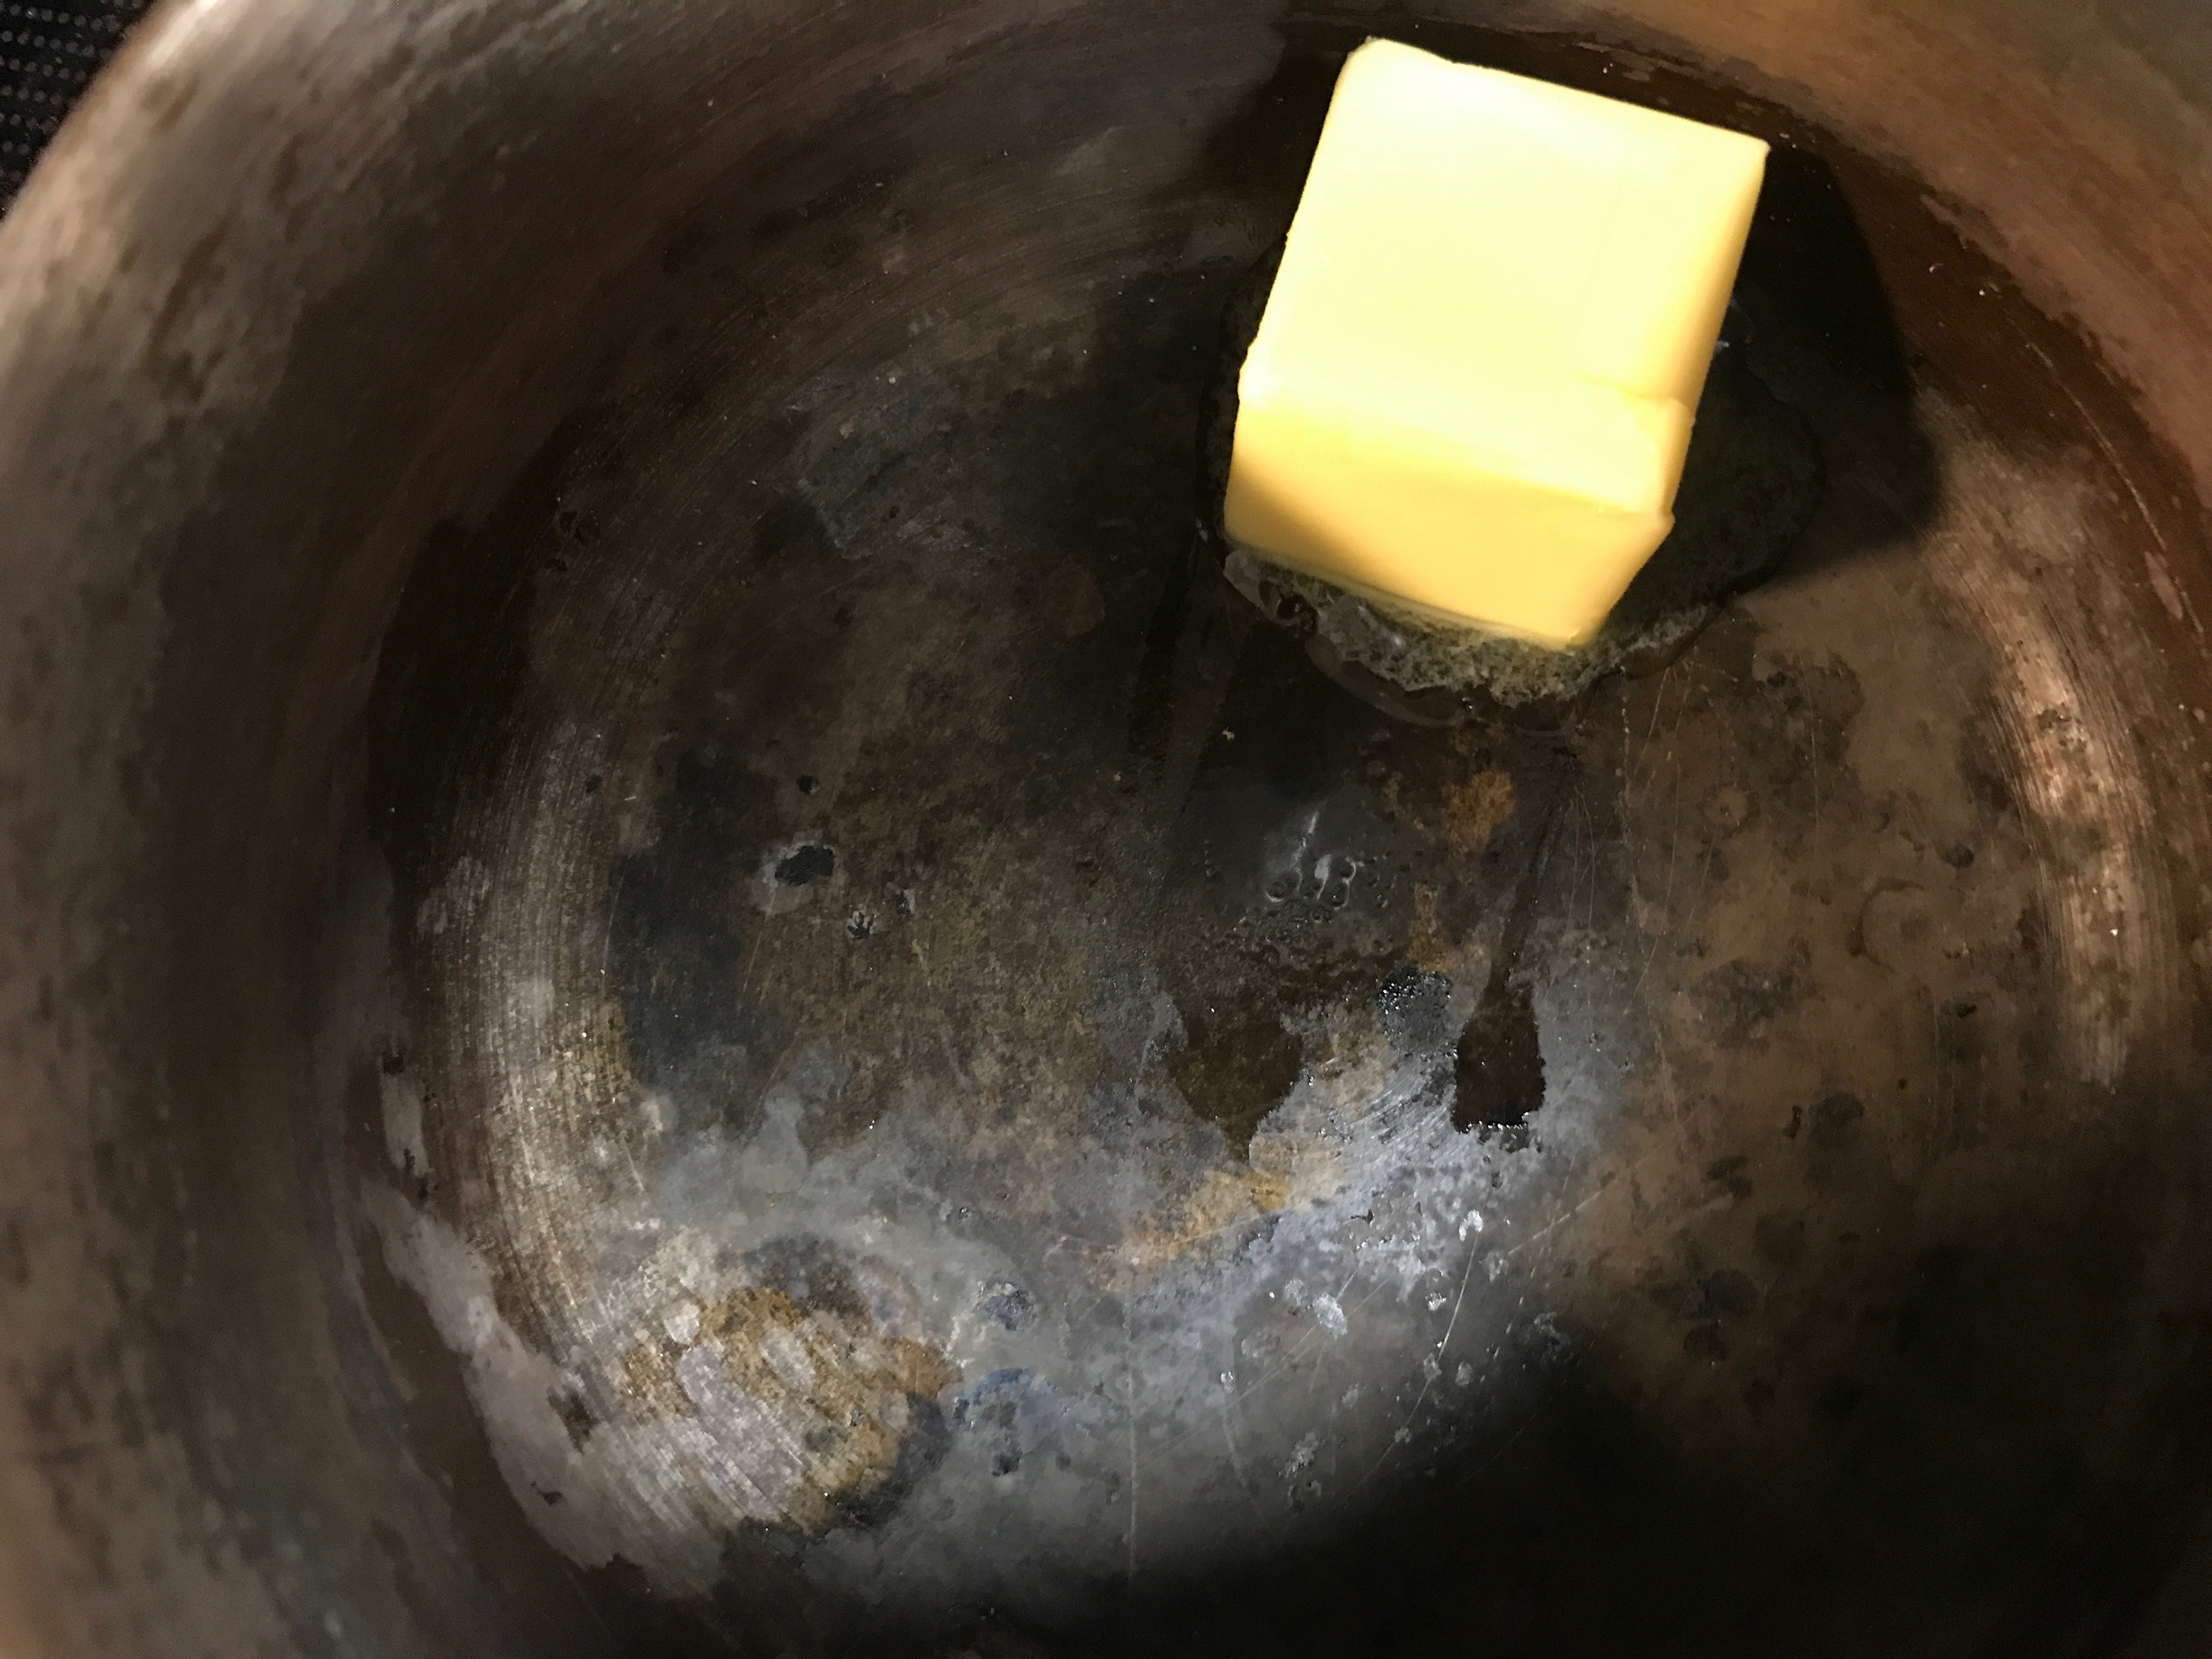
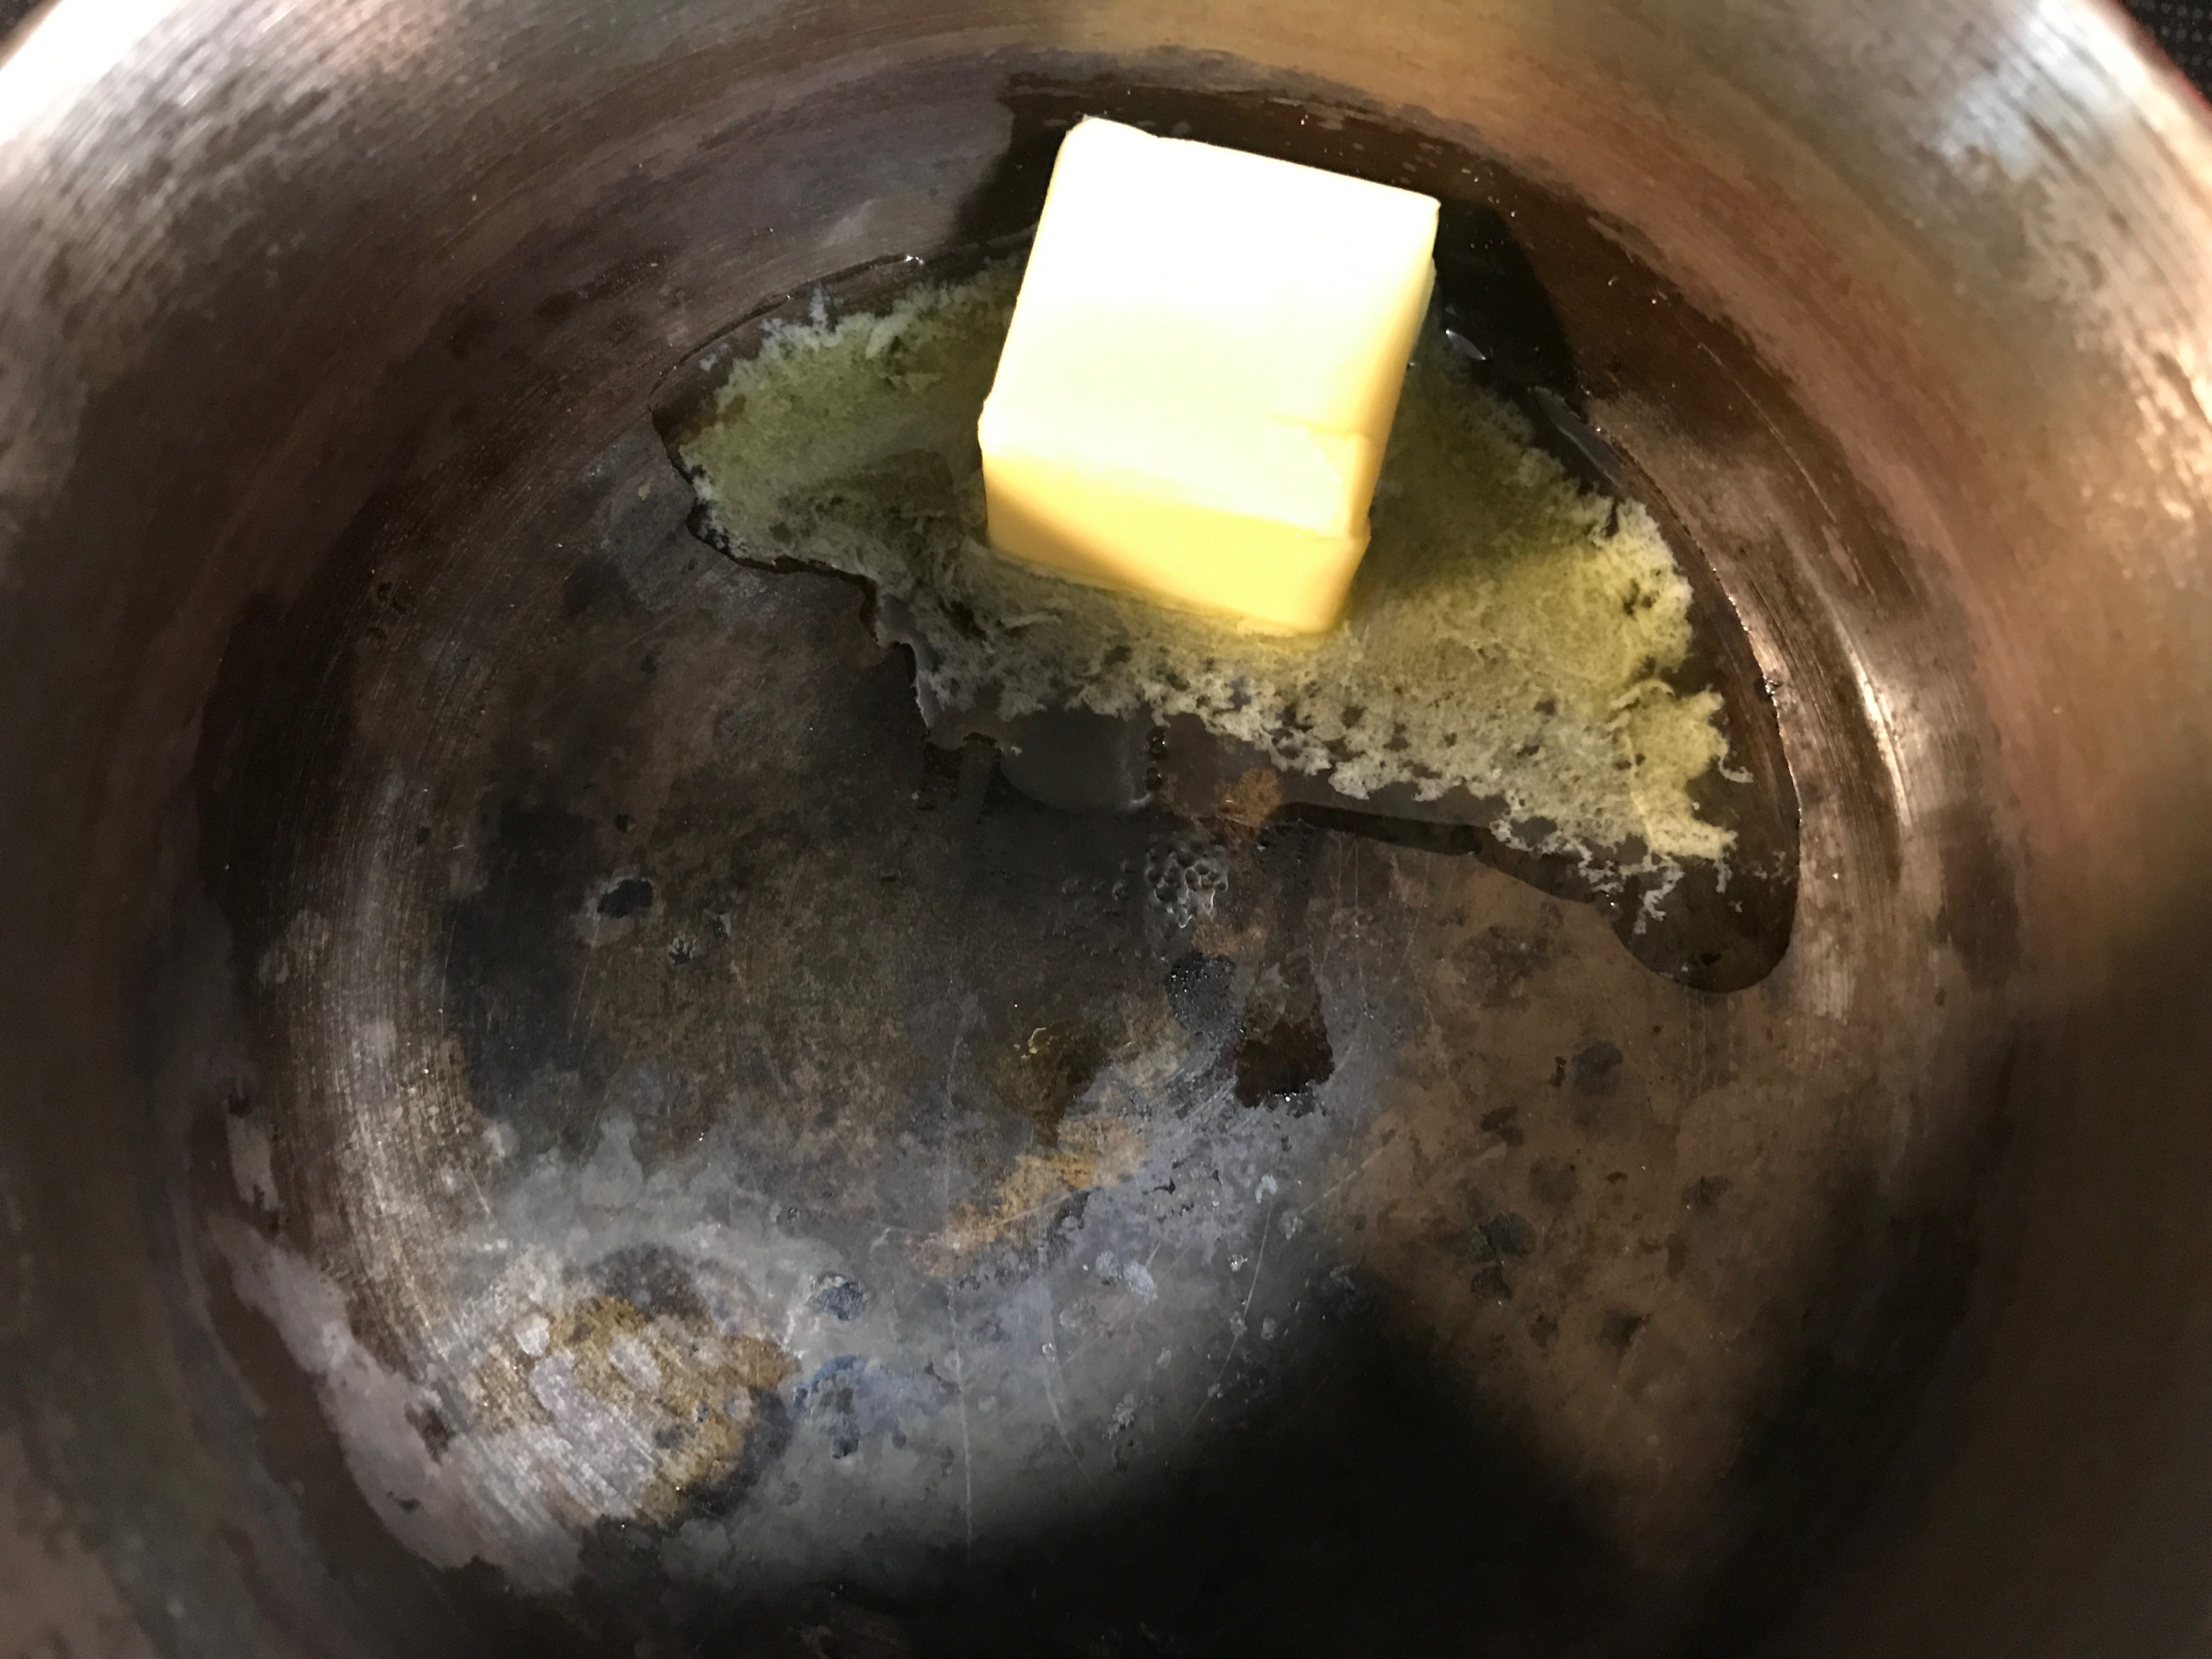
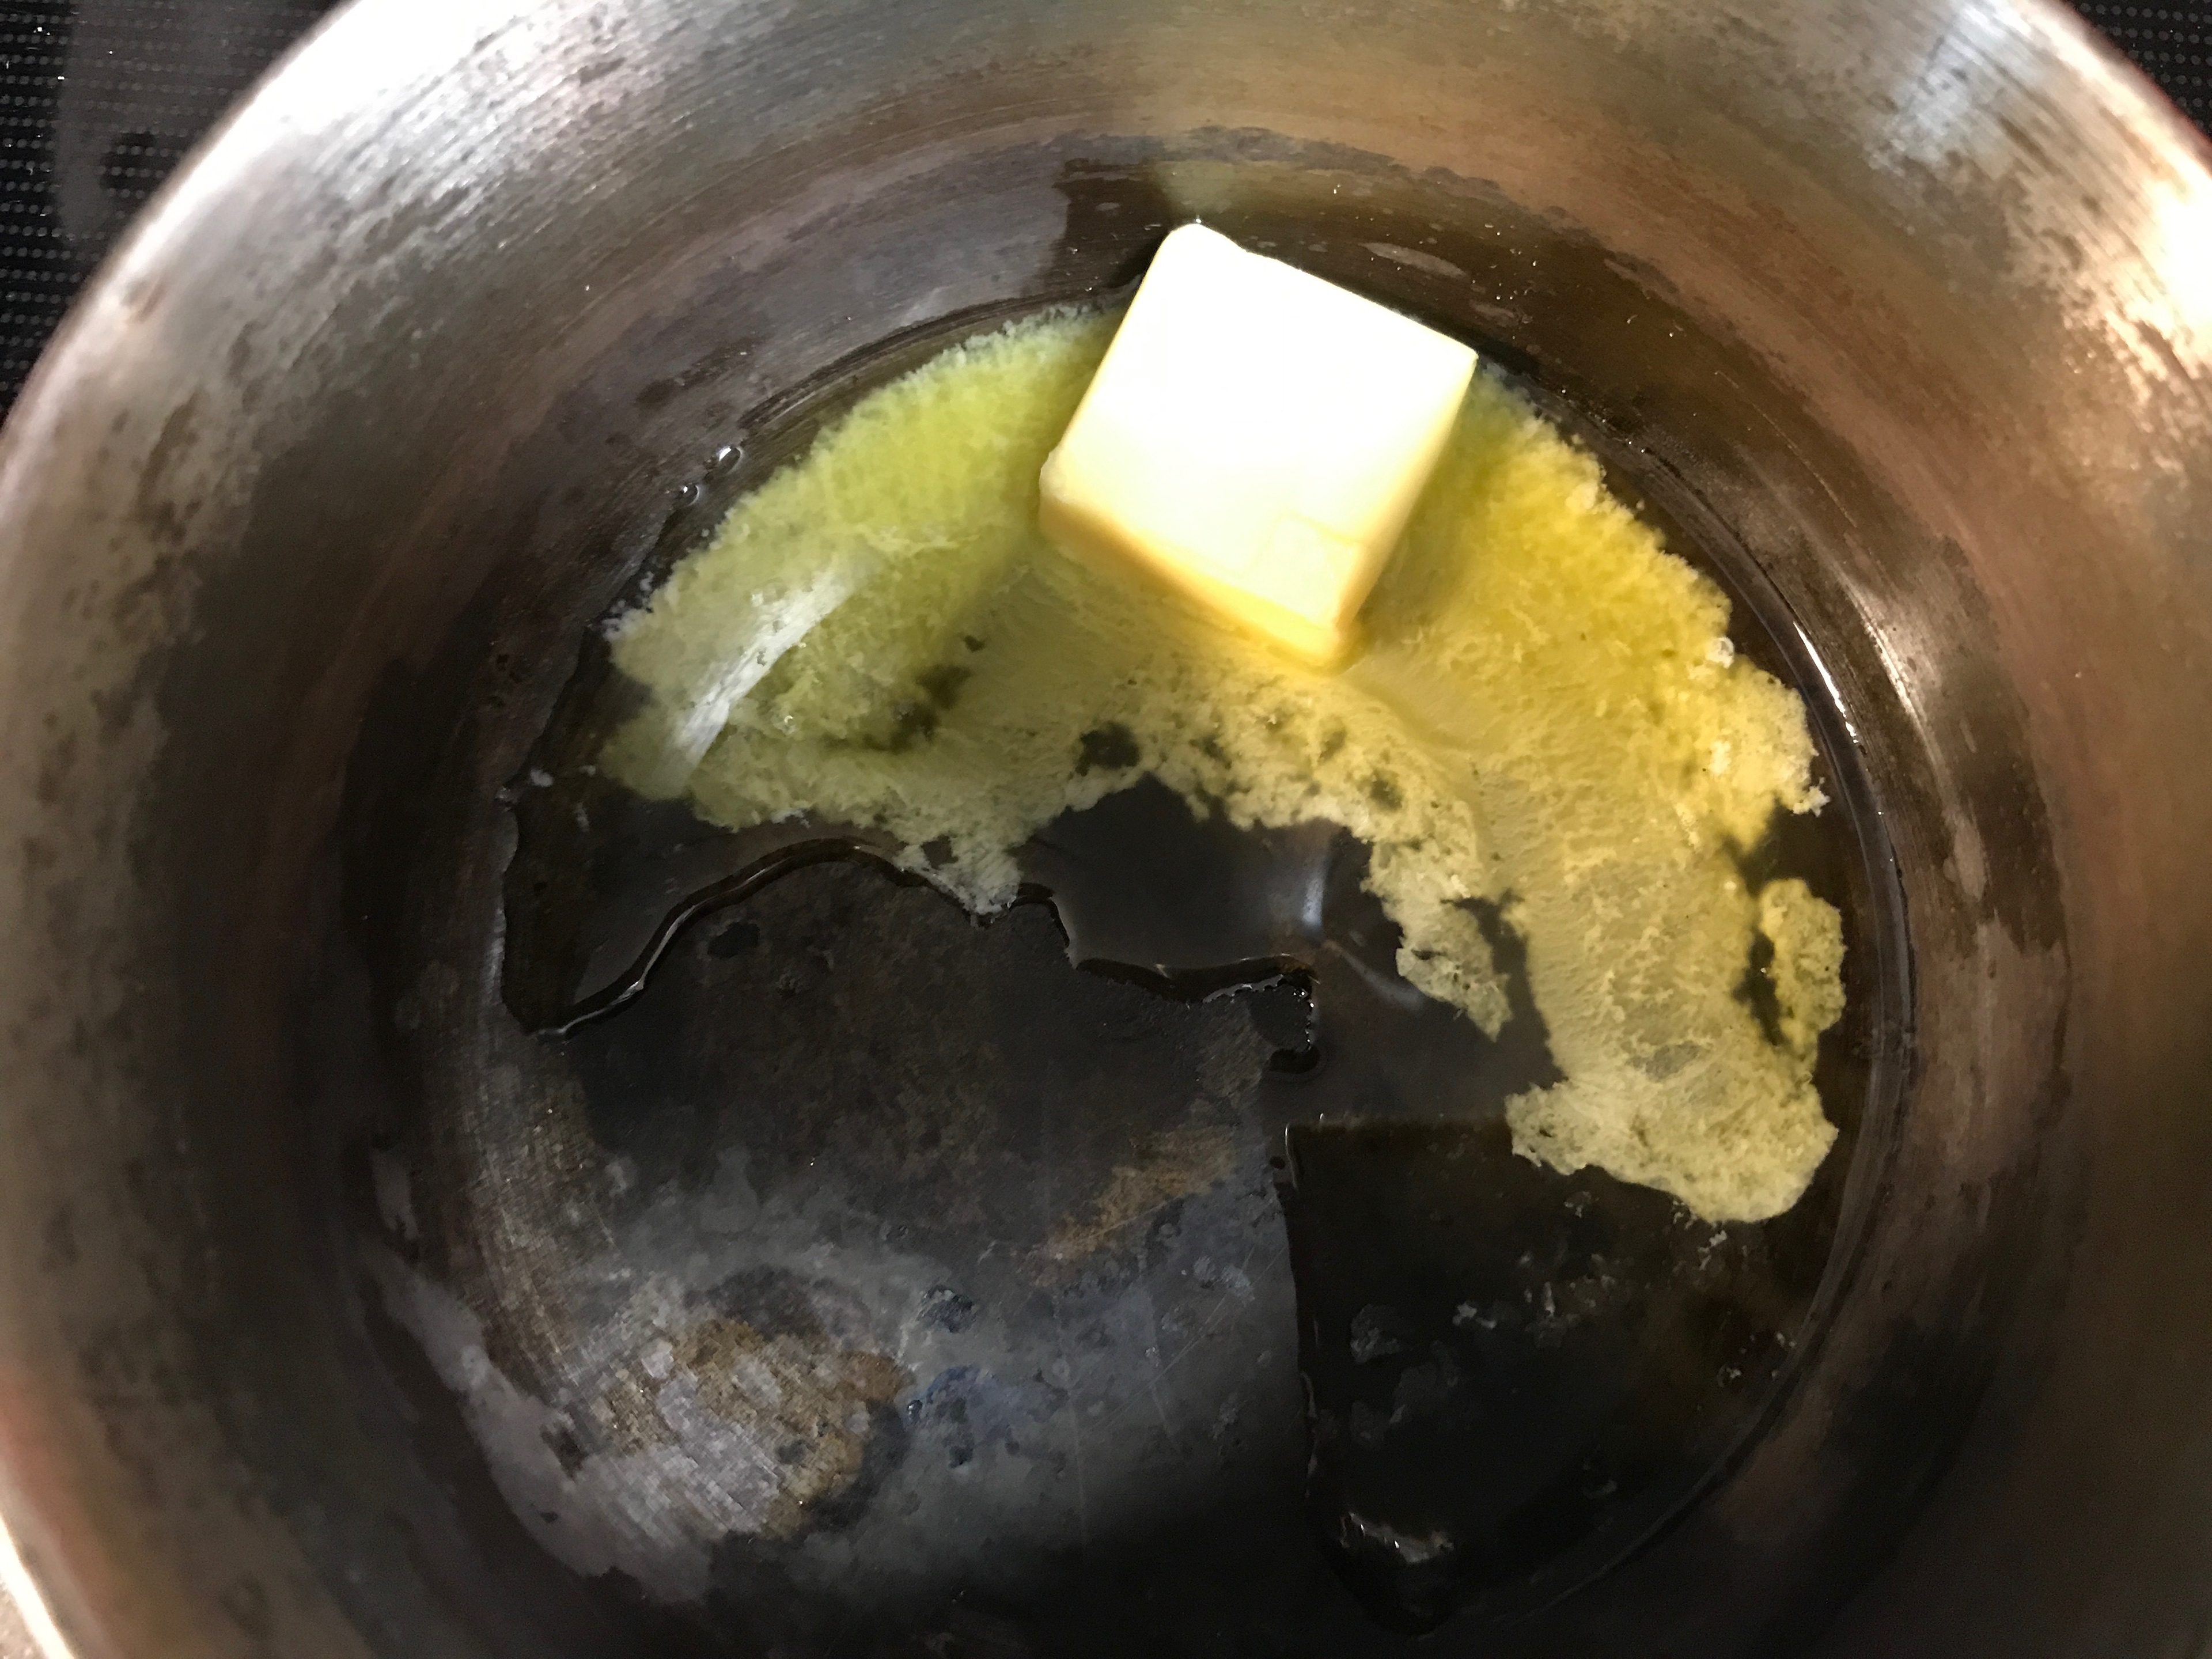
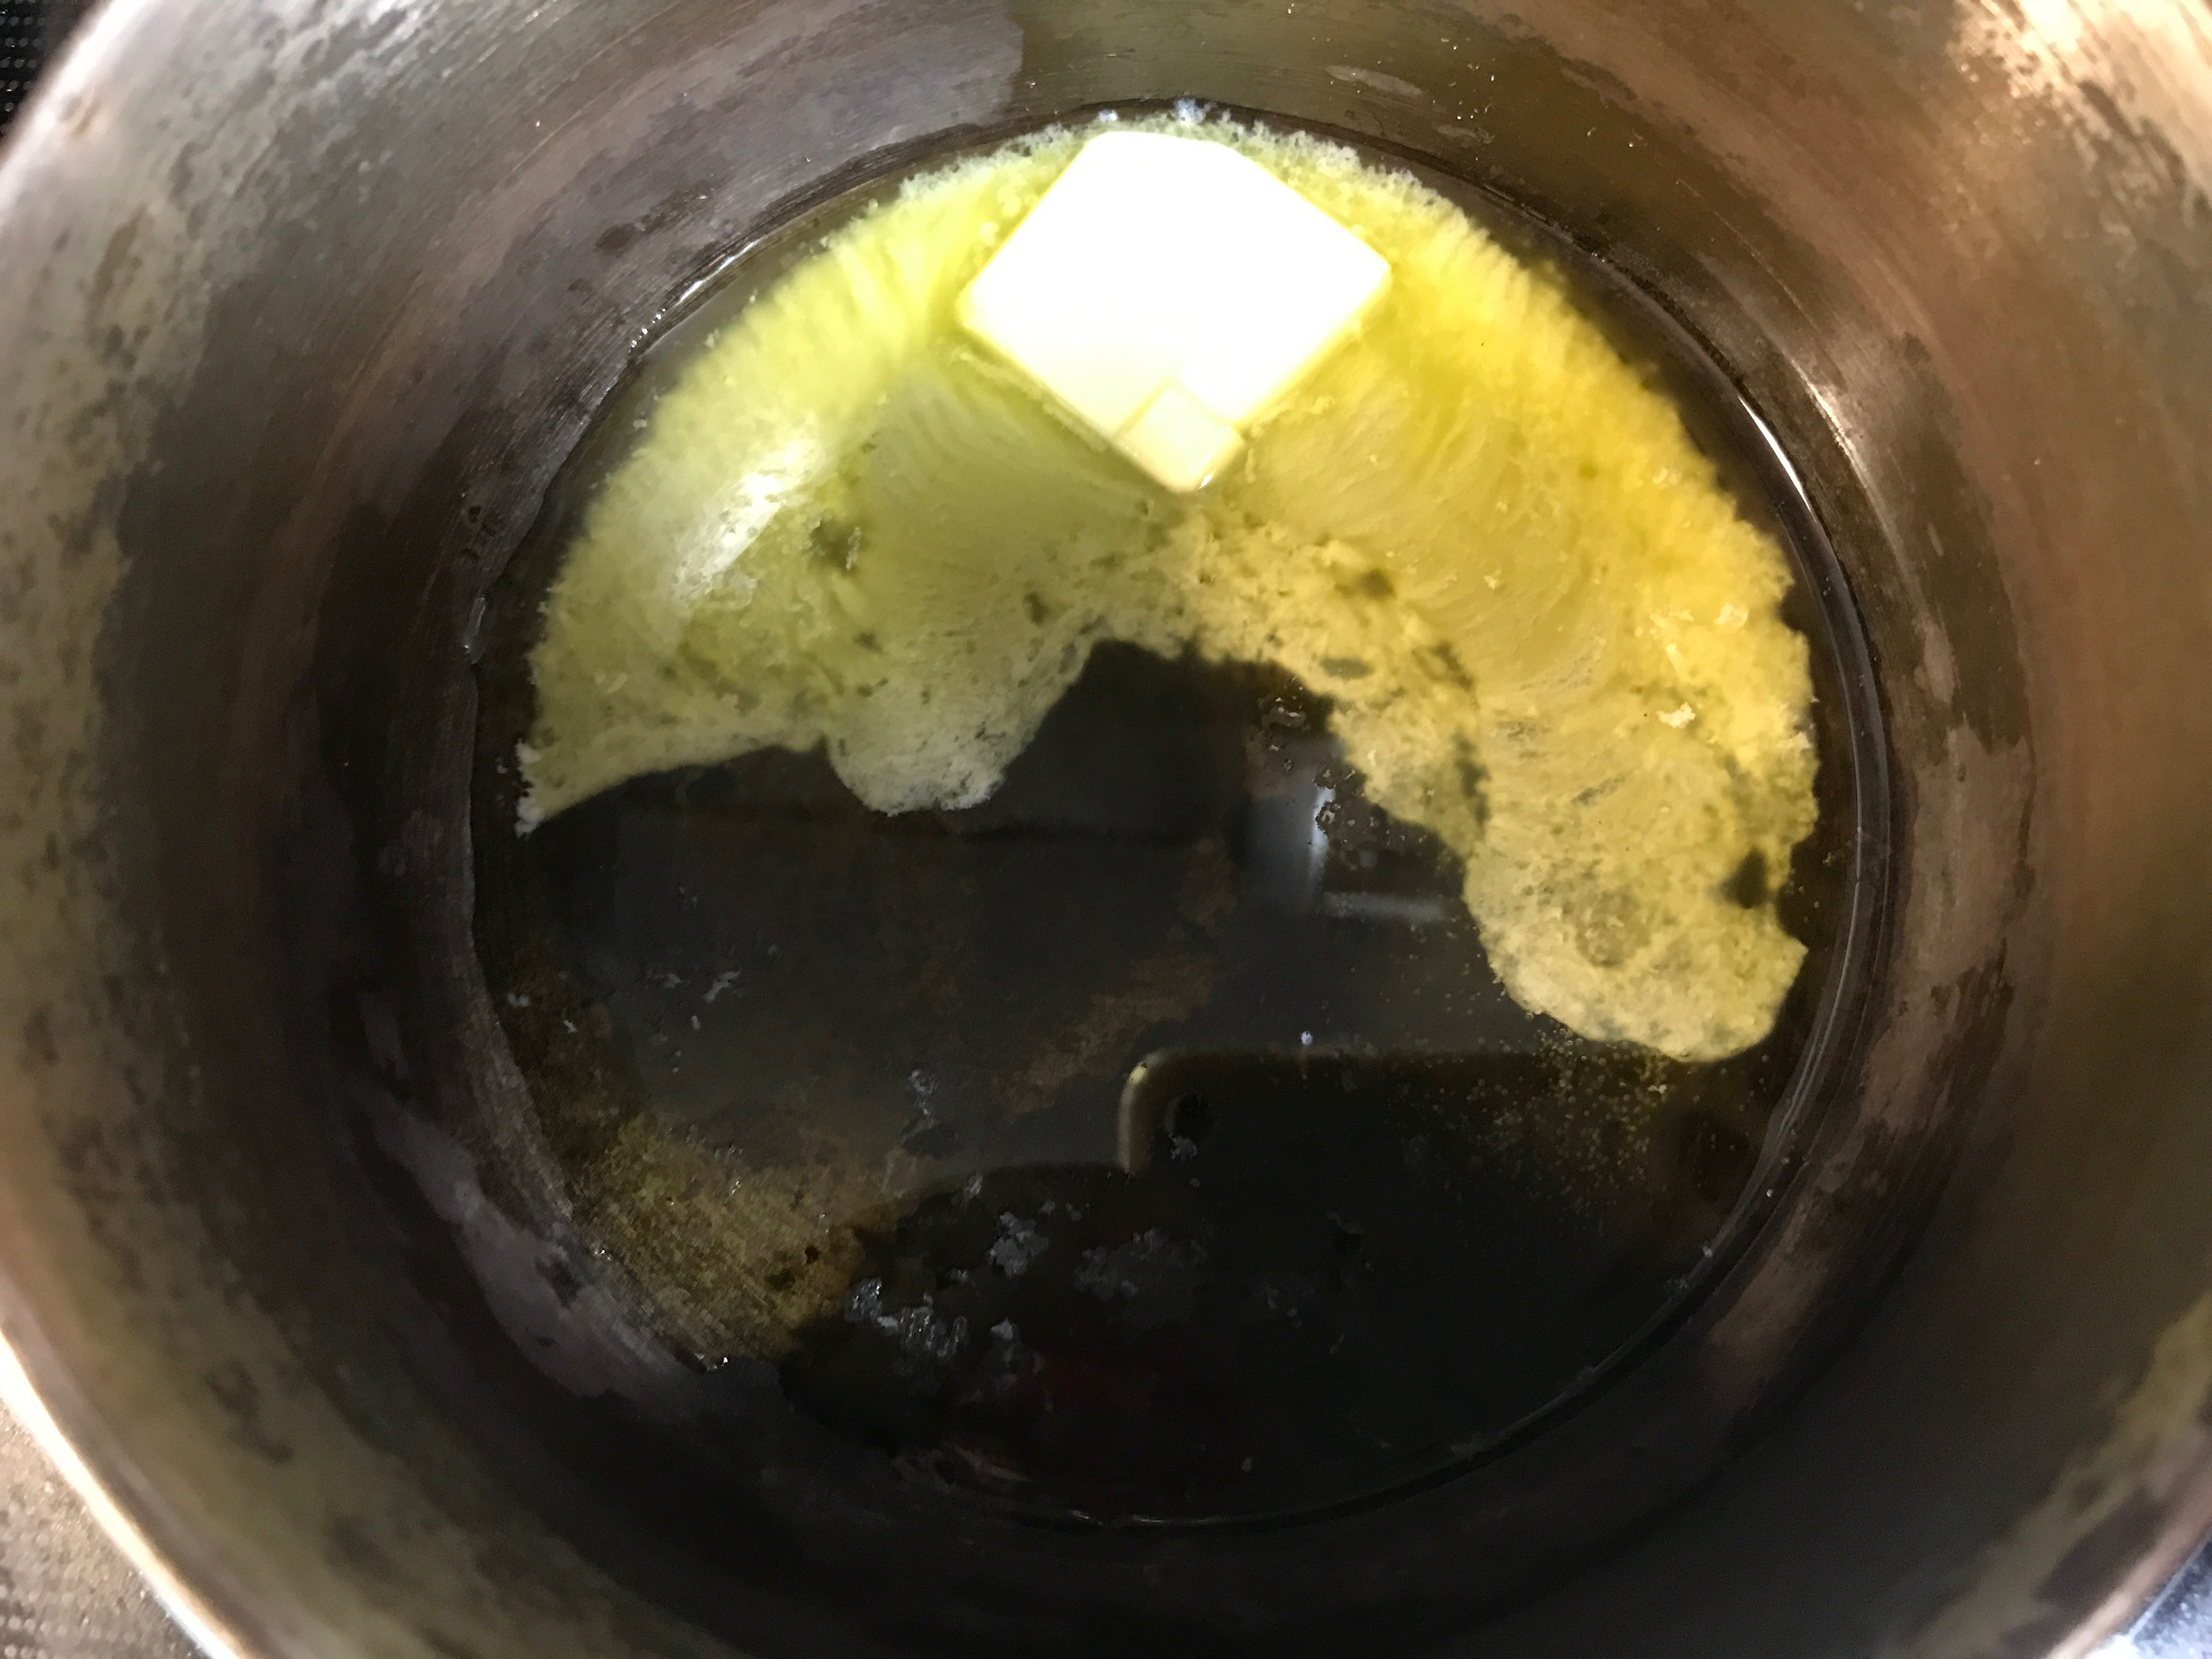
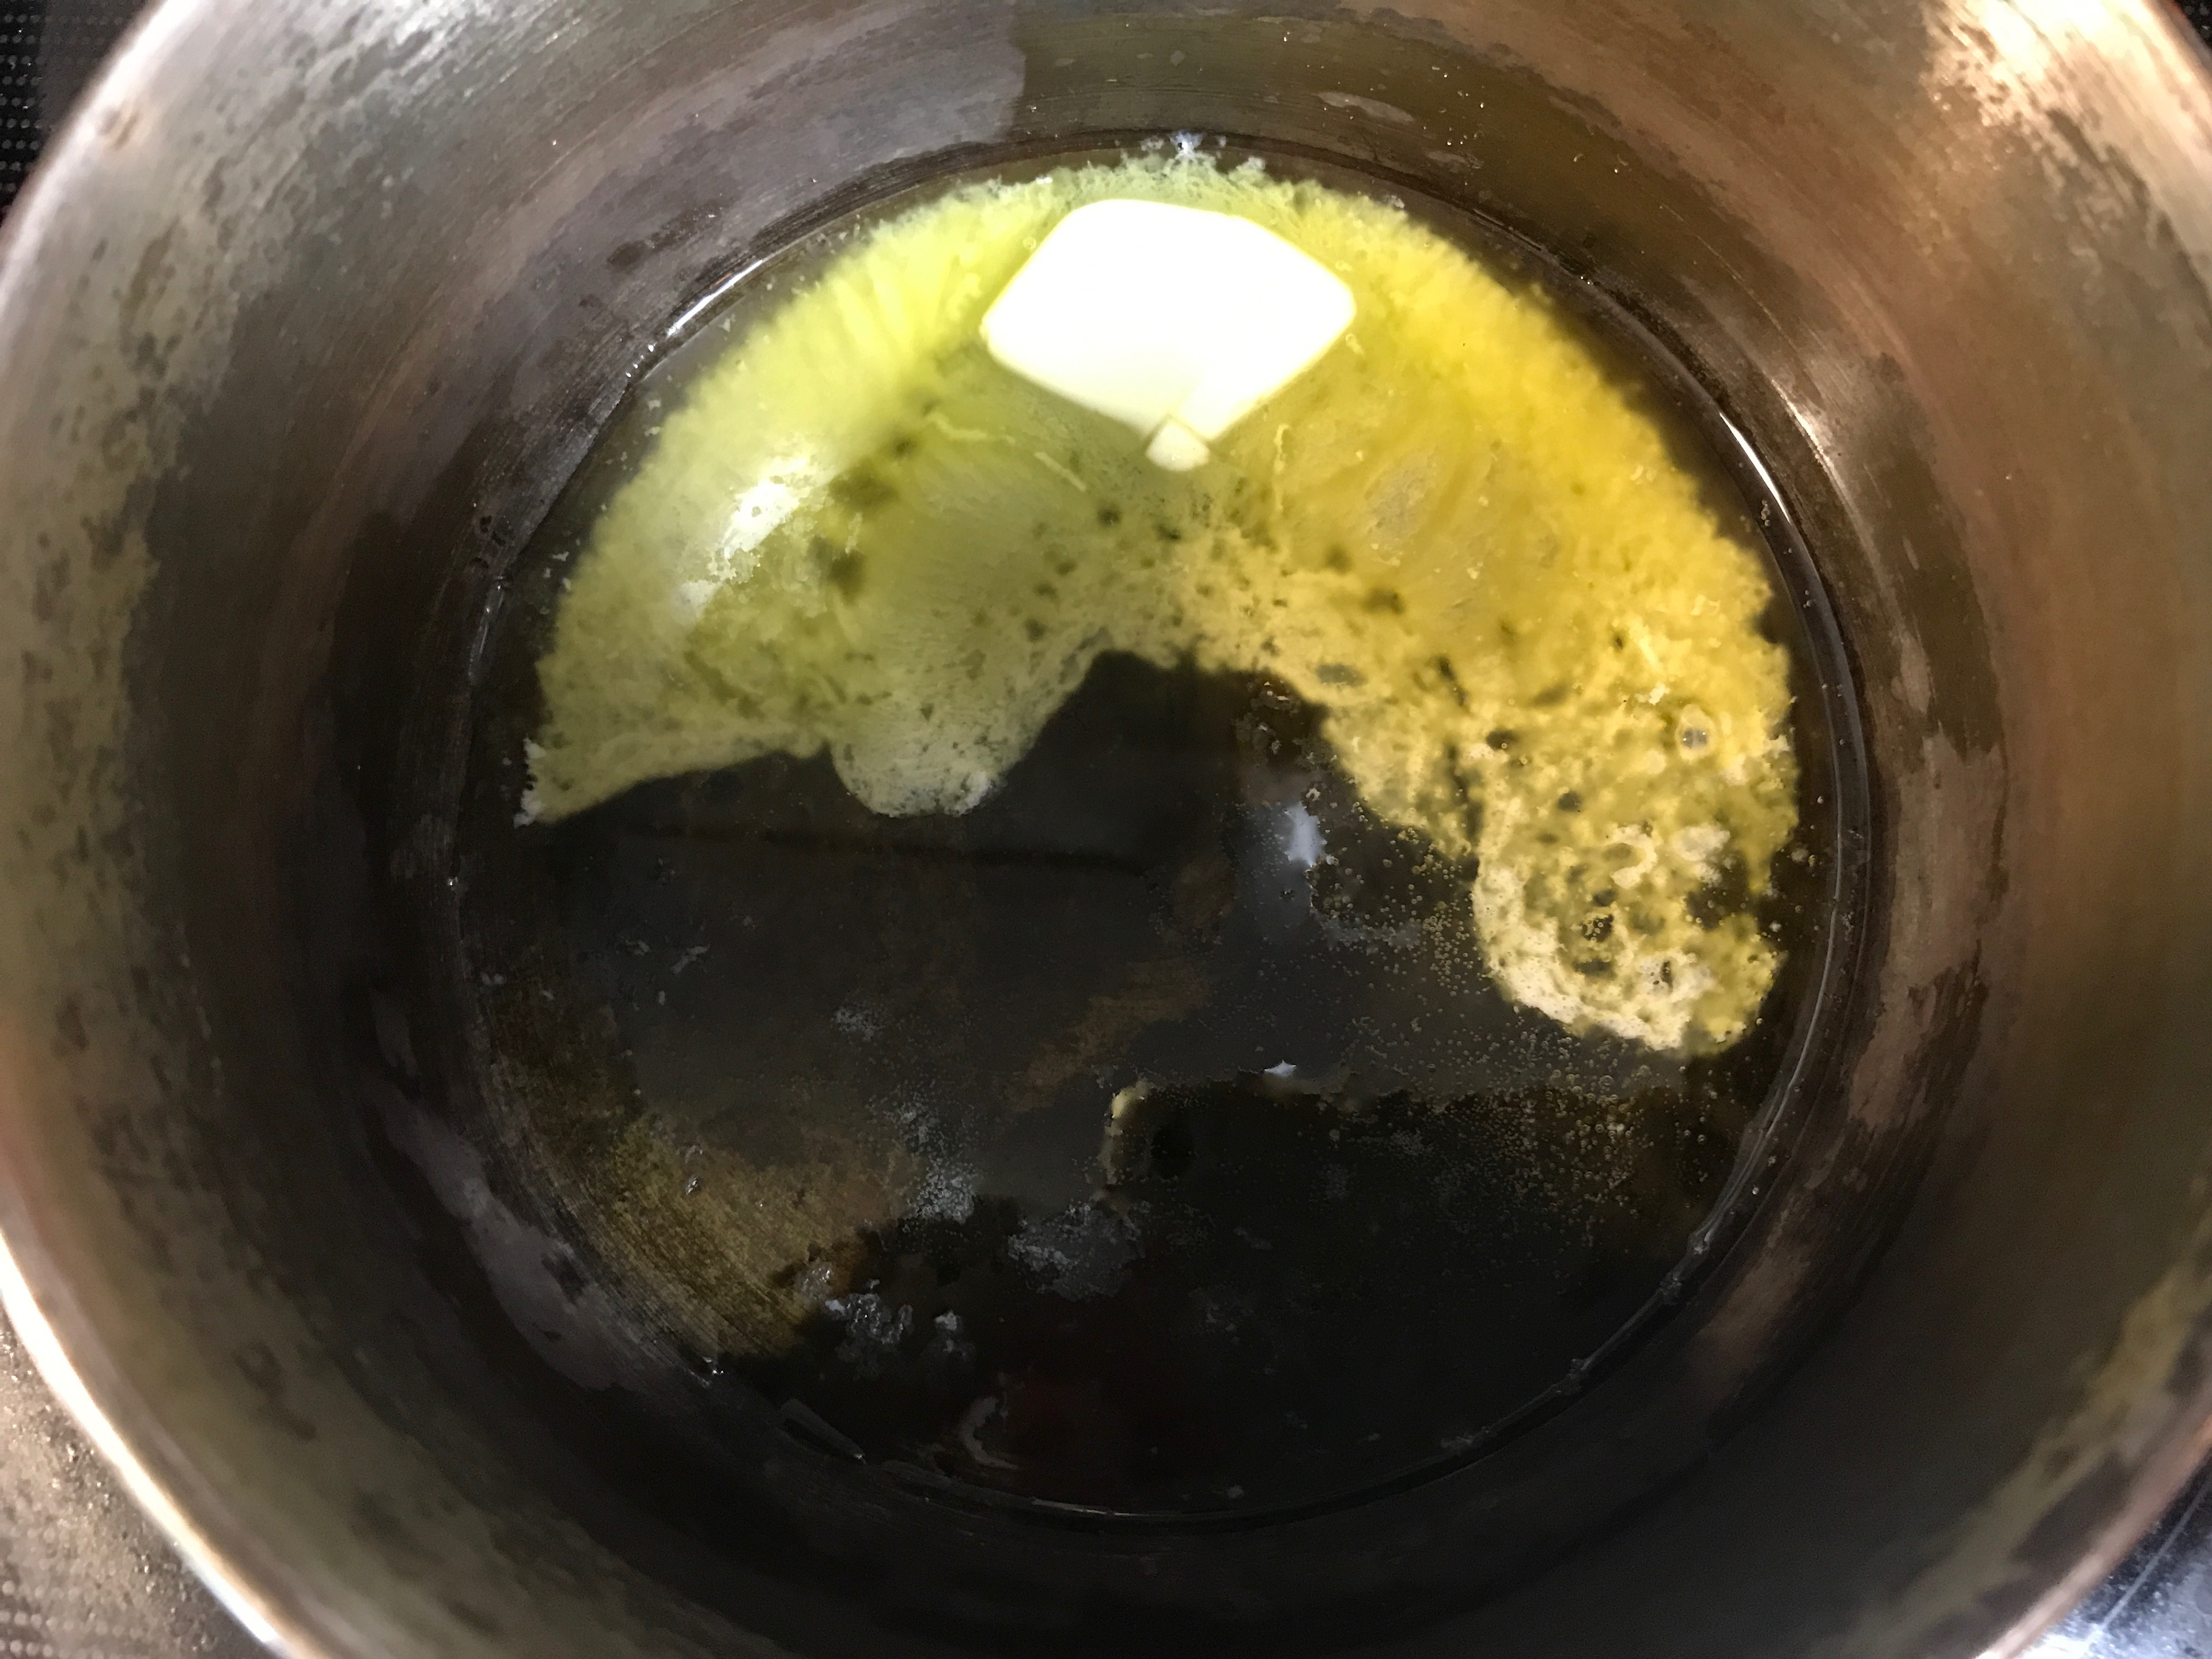
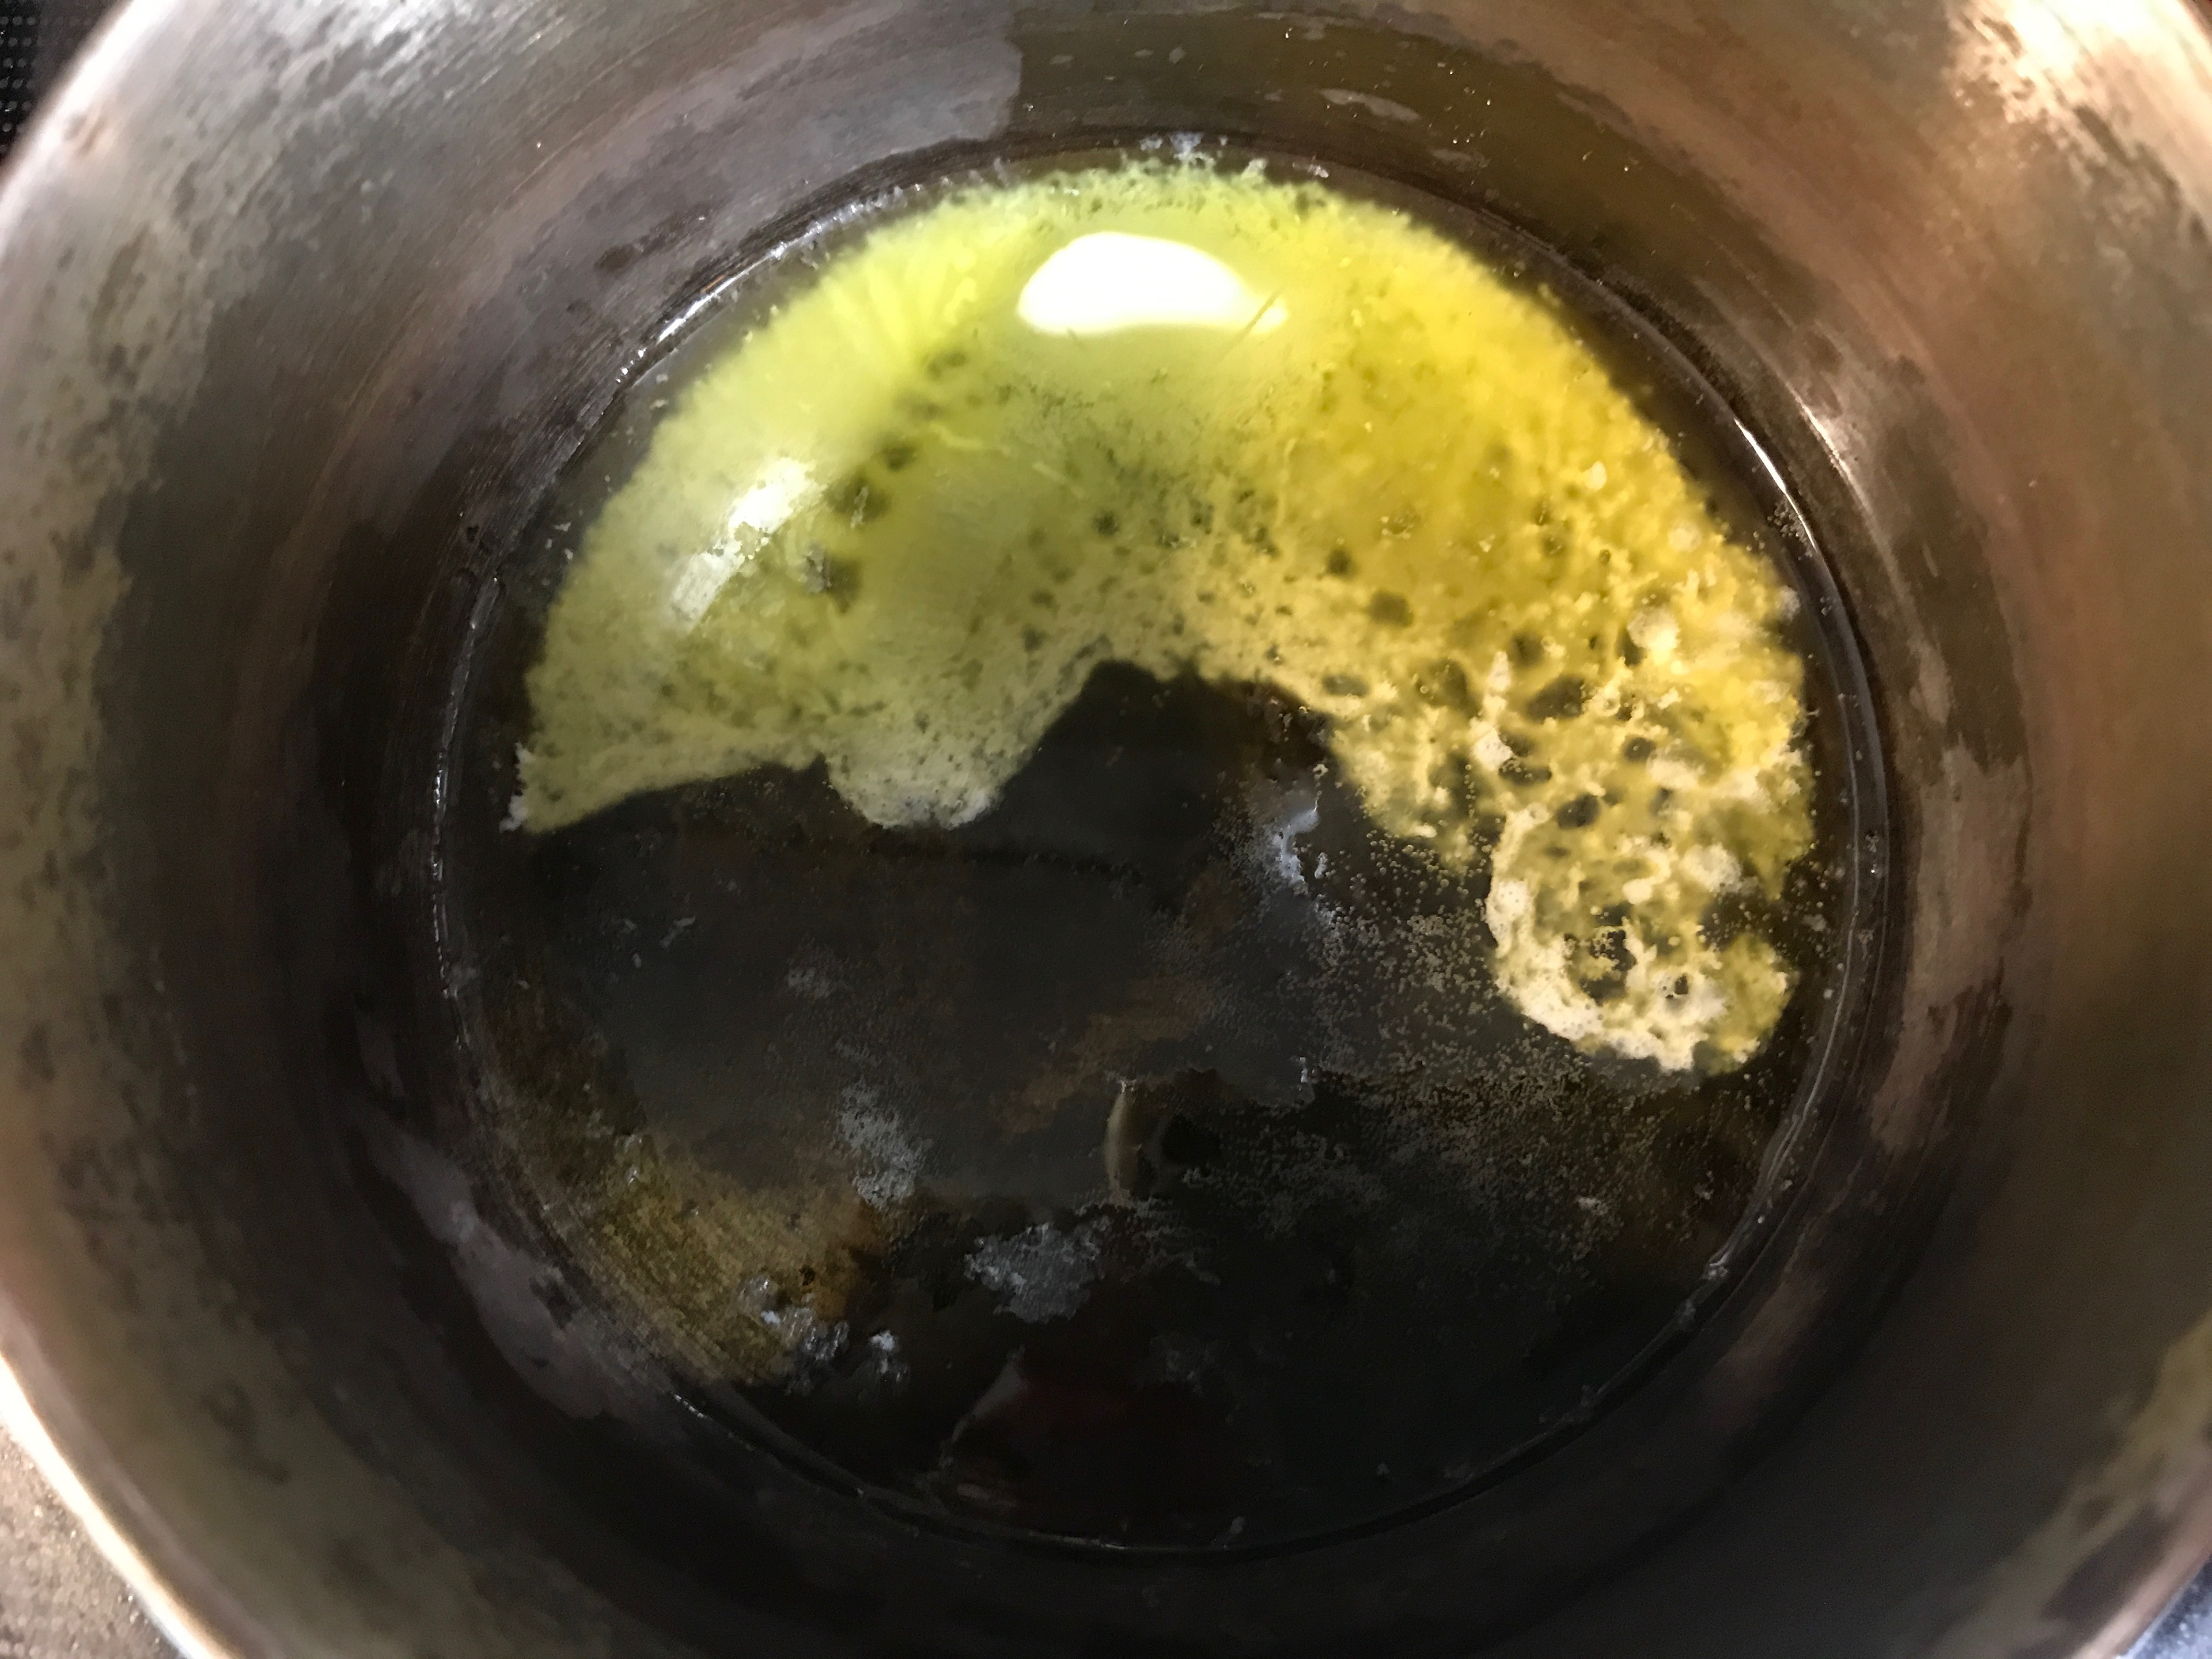
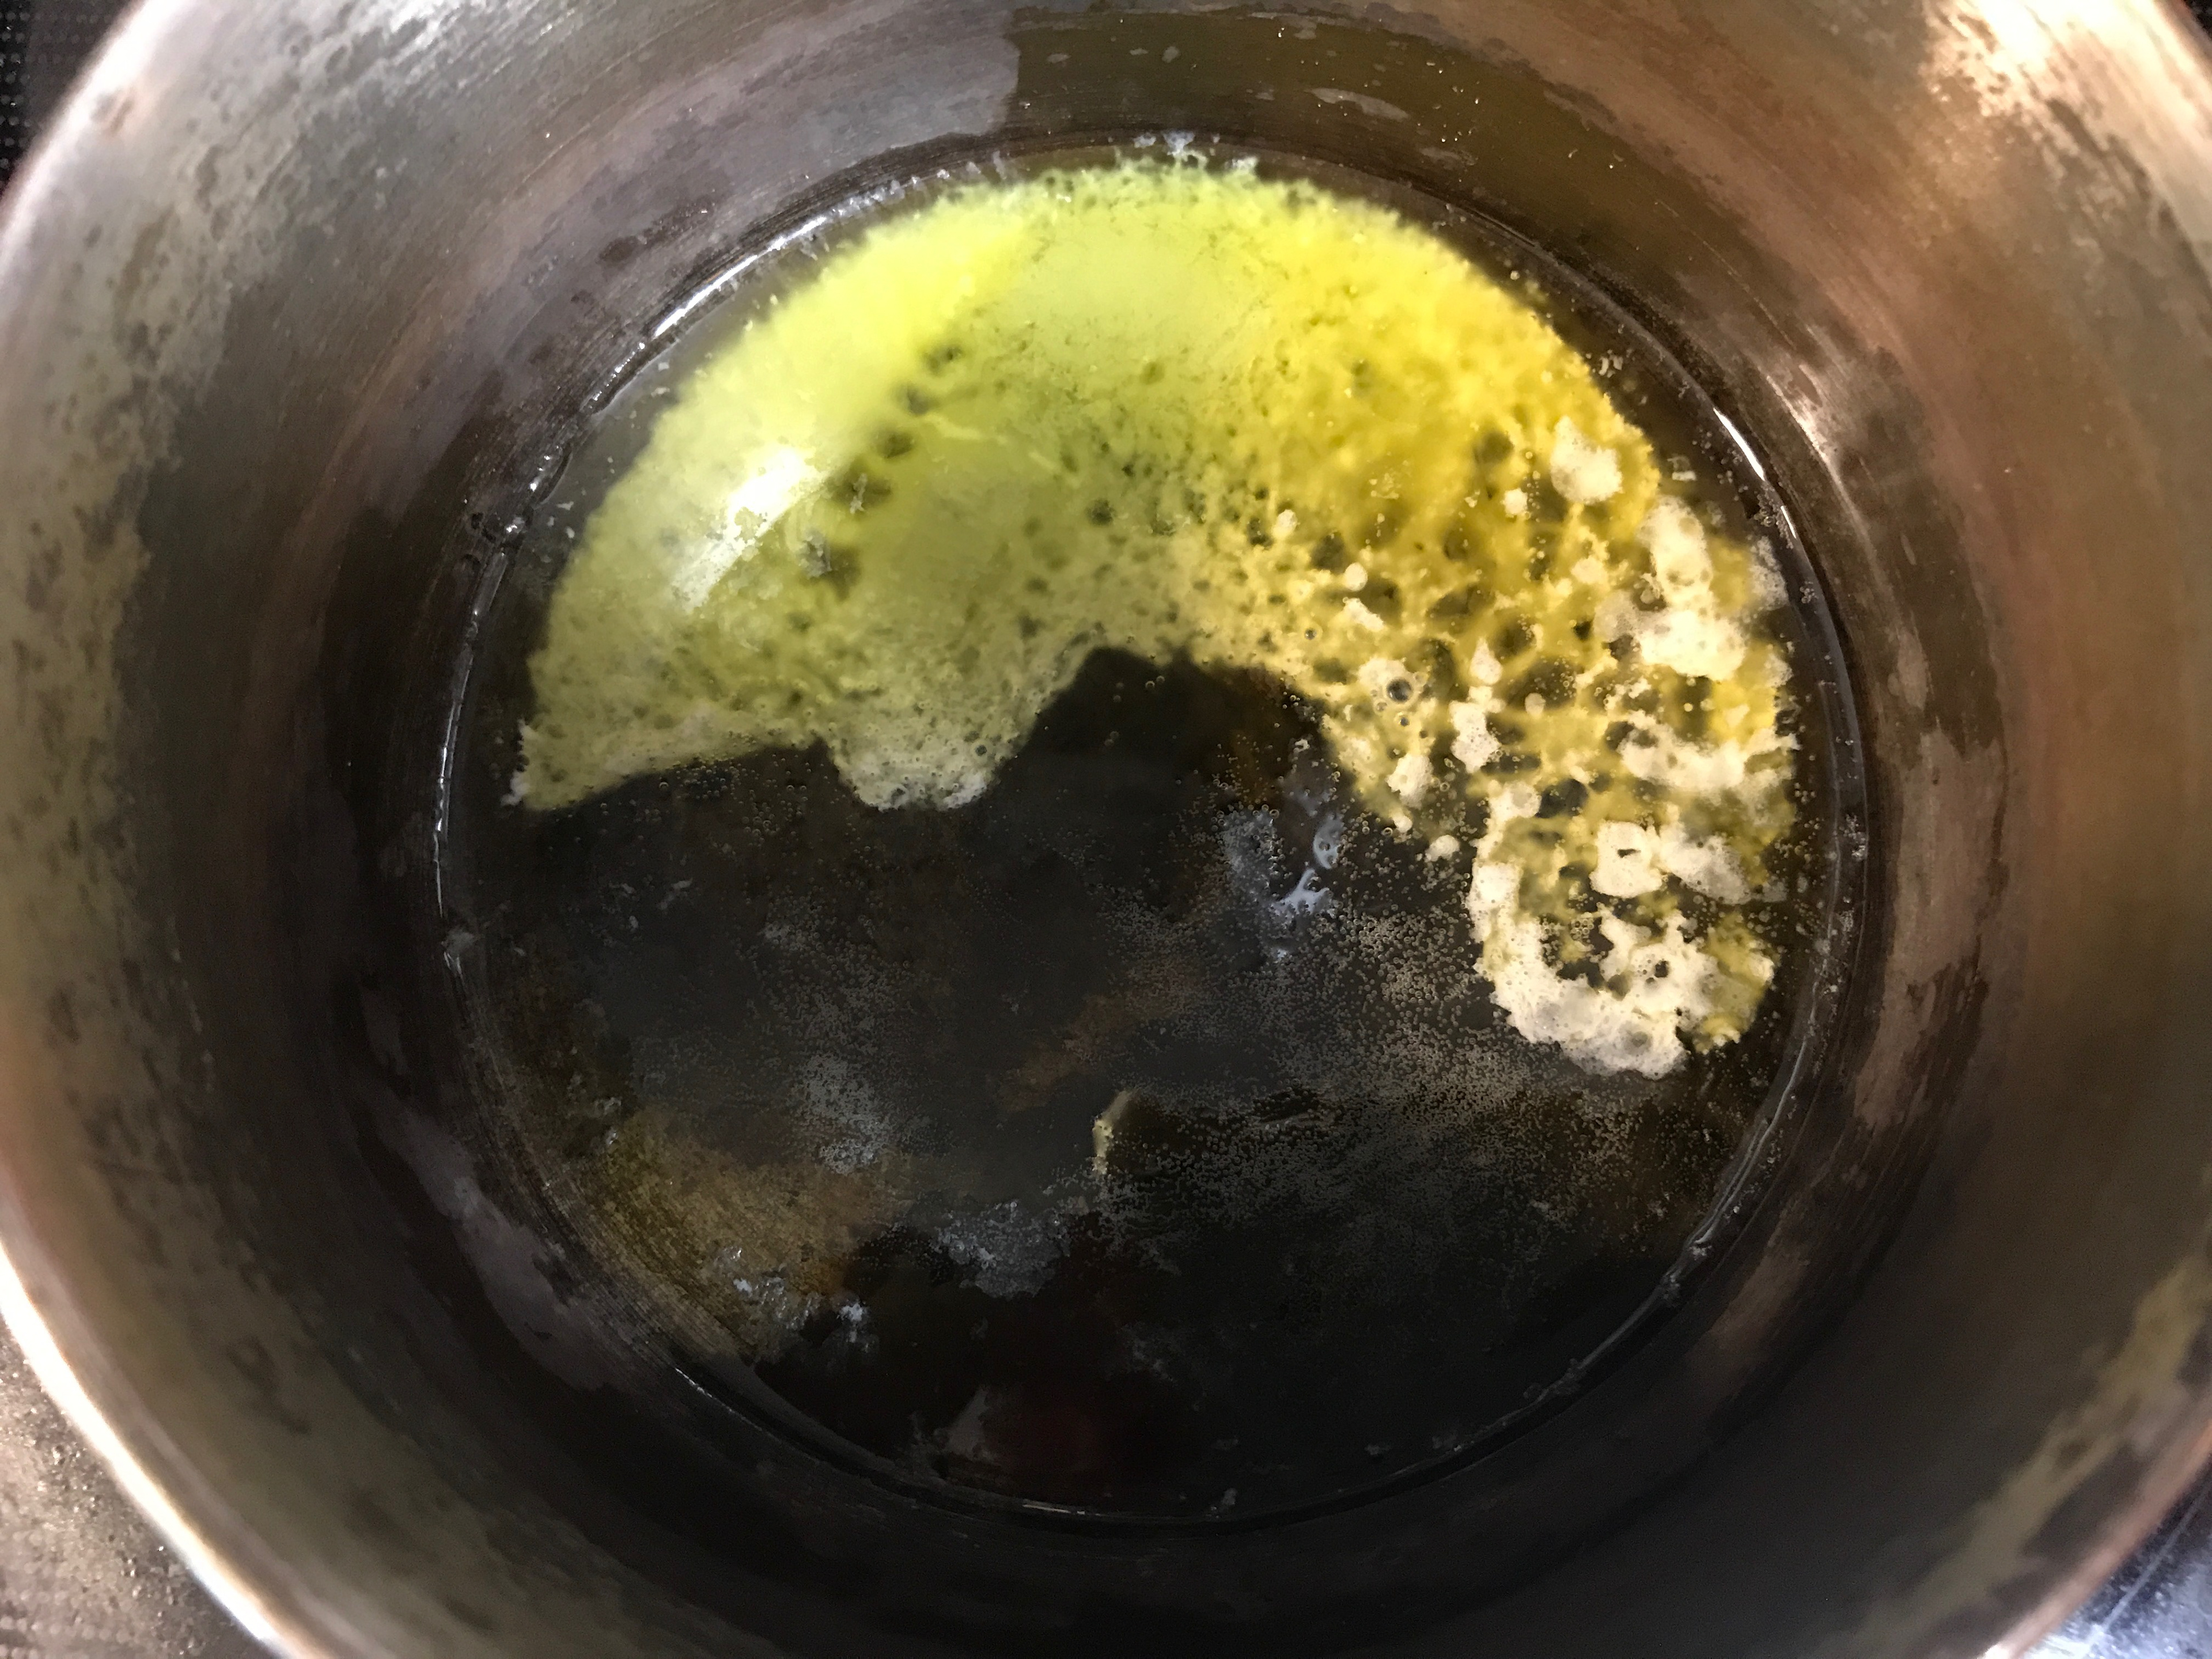
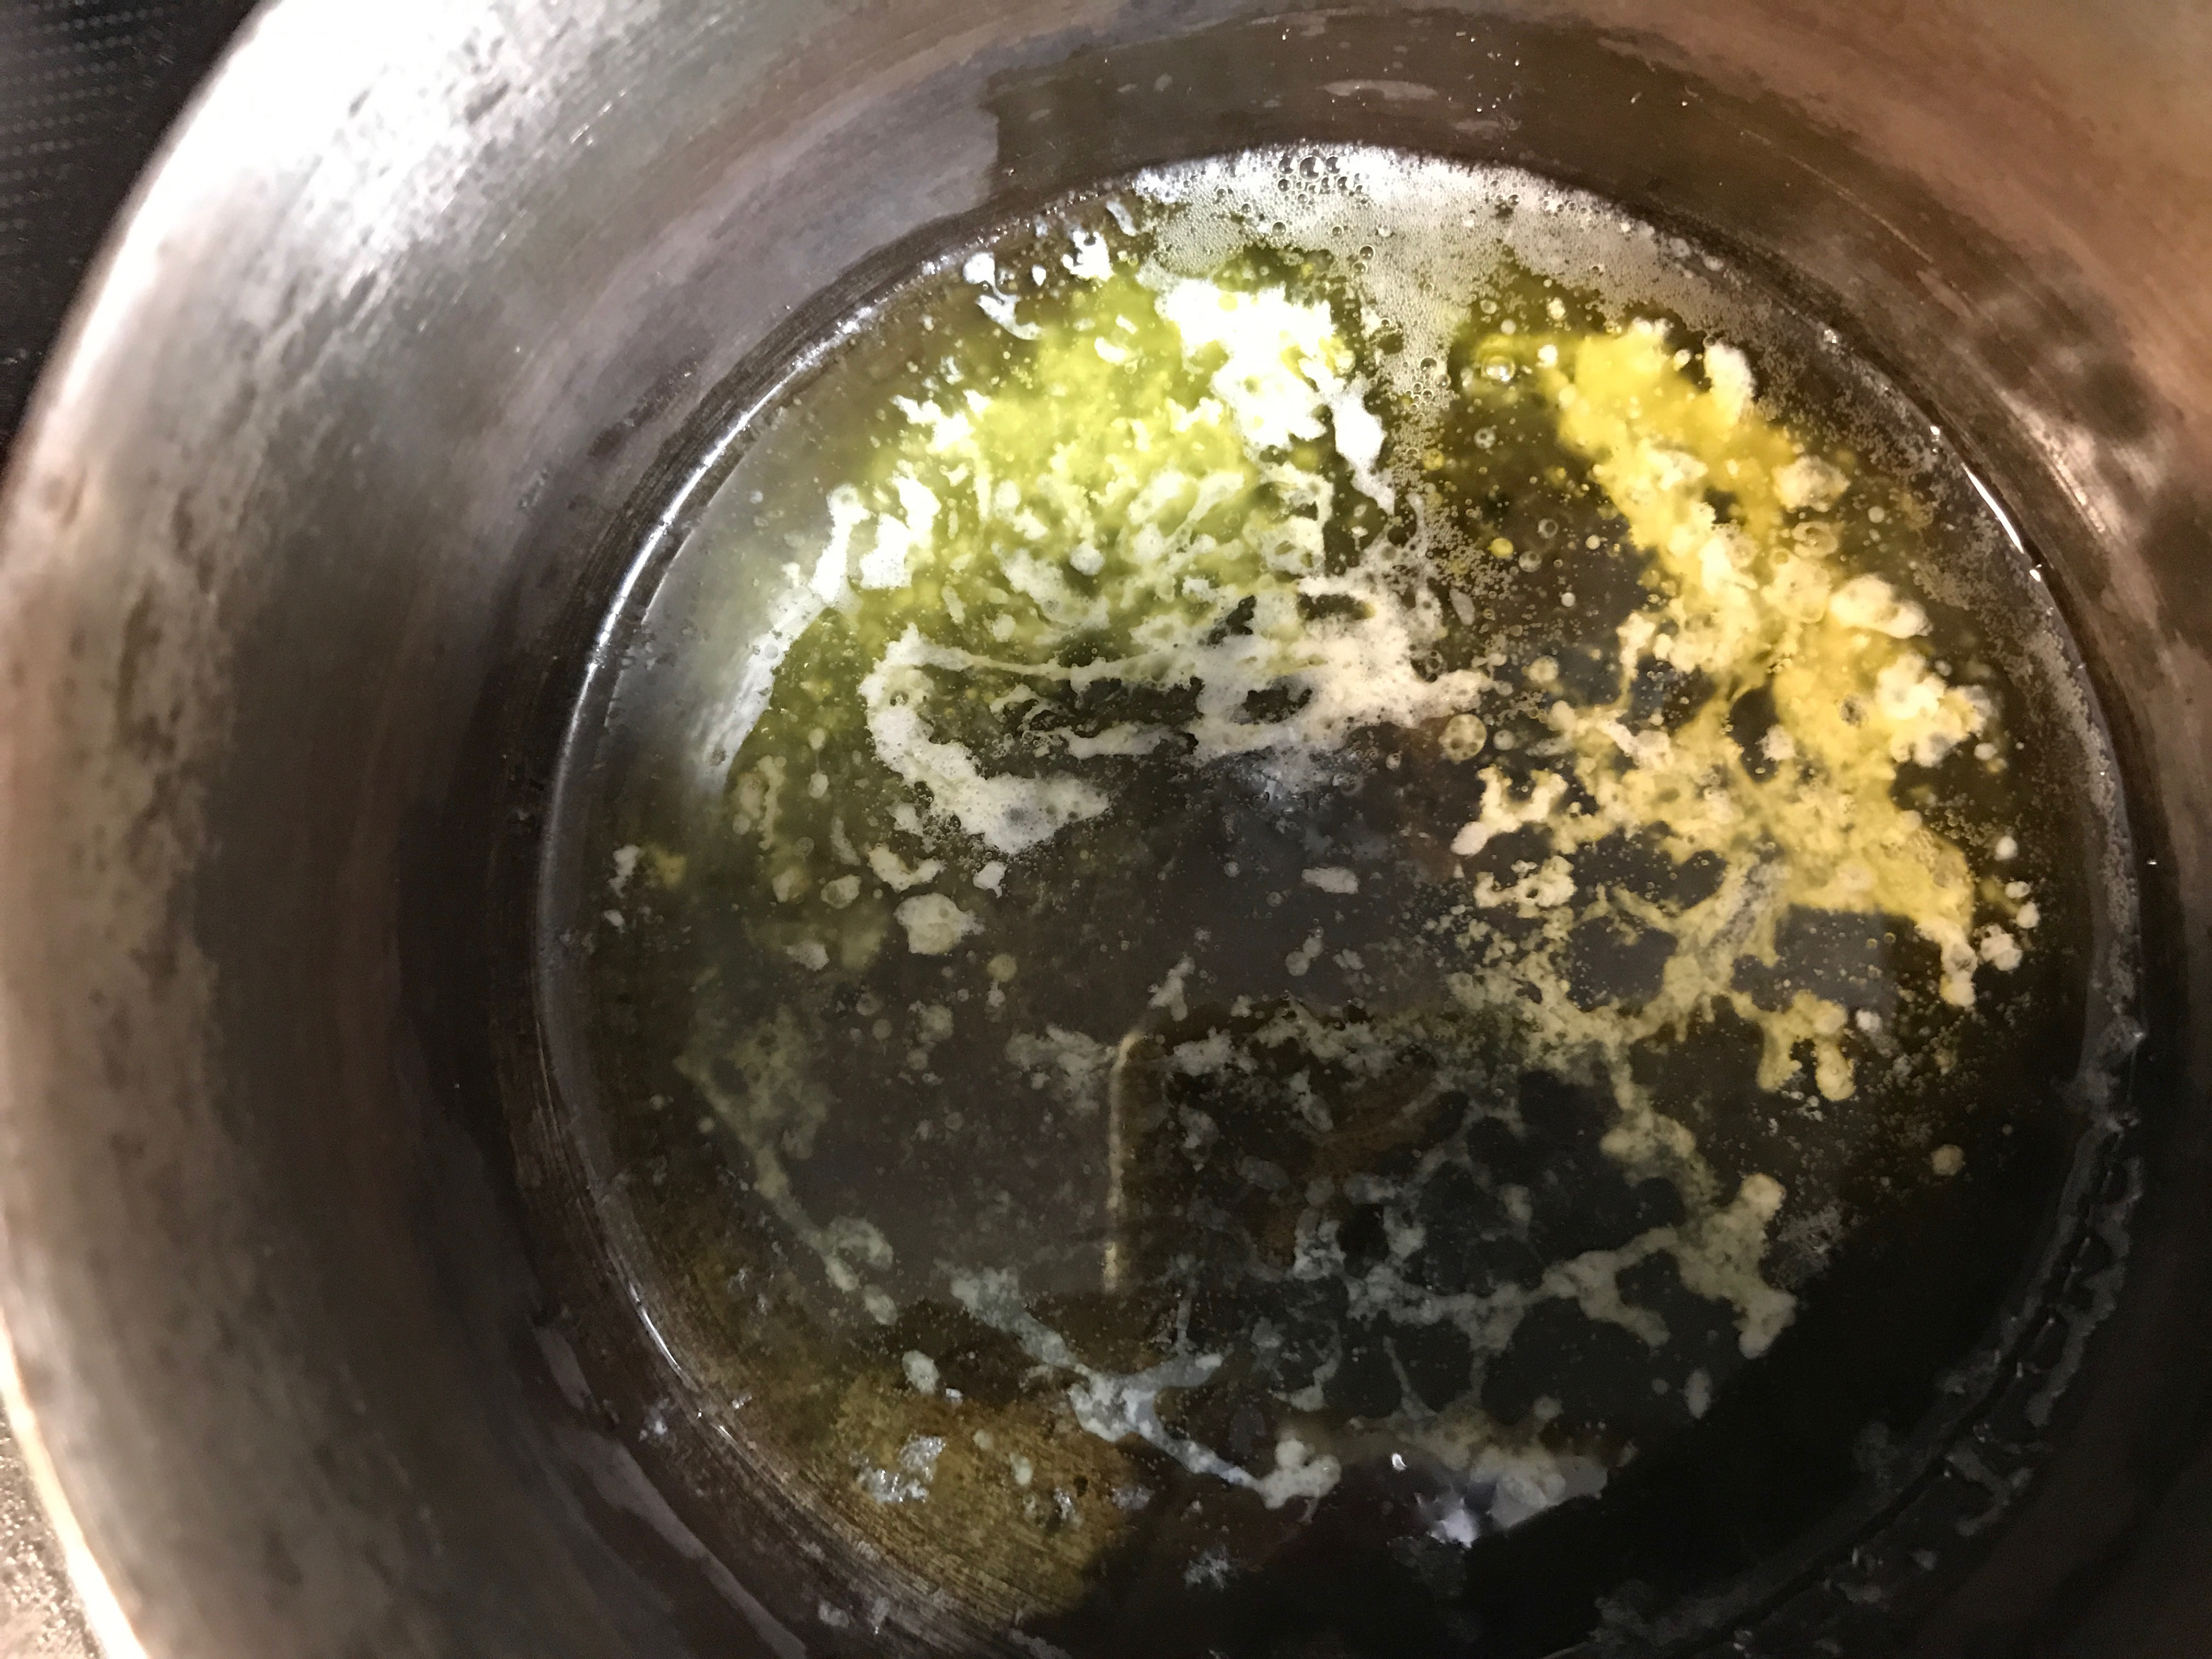
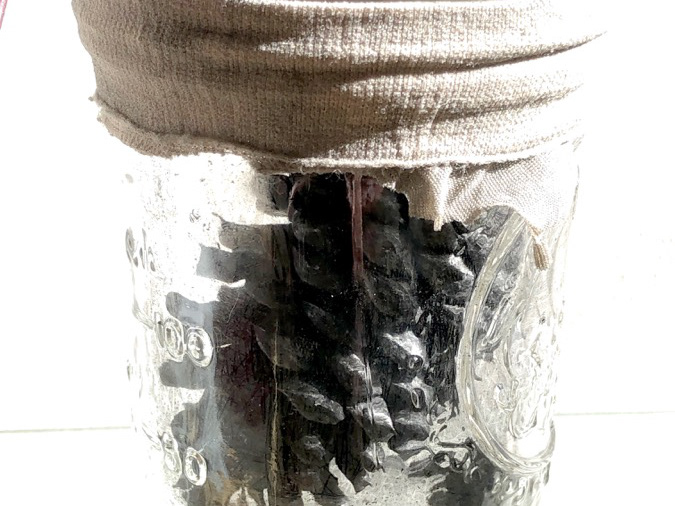
Process stage 3, Katherine Bennett, photos of butter melting in old pan. Traced areas of melting butter delineate the dissolving "continents" of the final drawing.
Refinement and development, phase 2. Based on discussions with teammates, classmates, and our class TA, I decided to explore my map of butter melting. Though cupcakes and Christina's idea are great, my memory-image of butter felt deeper. It carried more weight.
To recapture a more believable and evocative image of this transformation, I photographed a two-tablespoon chunk of butter melting in two different pans, one old and tarnished, the other fairly new. The butter behaved about the same in both pans -- traveling from the center to the upper right periphery as it started to melt. I found myself melting with it, especially in the old pan, remembering.
My mother and I used the older pan to make chocolate chip cookies when I was a kid. We would melt the "2 tbsp of butter" in our recipe. I remember unwrapping the chilled stick of butter in perfectly folded wax paper, the warm smell of it melting, the sugary texture of cookie dough, the scalding taste of chocolate cooling on sheets of wax paper. I remember the pleasure of making things with my mother, and eating cookies with my parents over the next days.
Process stage 4, Katherine Bennett, drawing tests. Prints of digital drafts testing different colors, outlines, and calibration options.
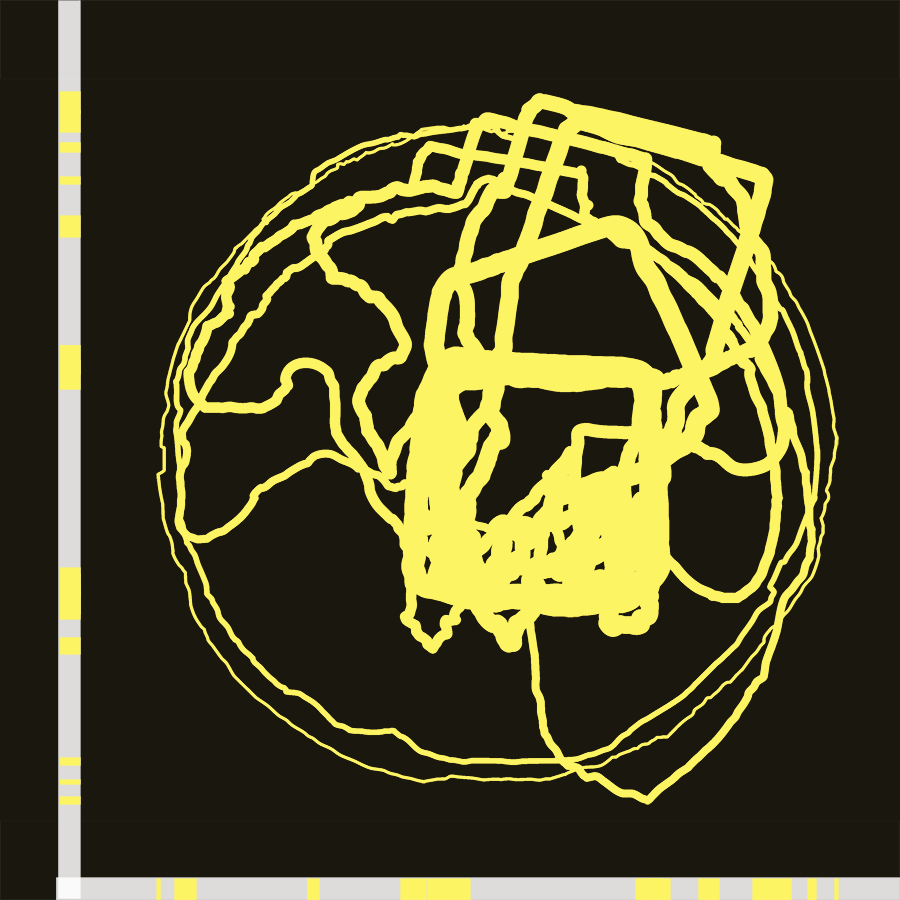
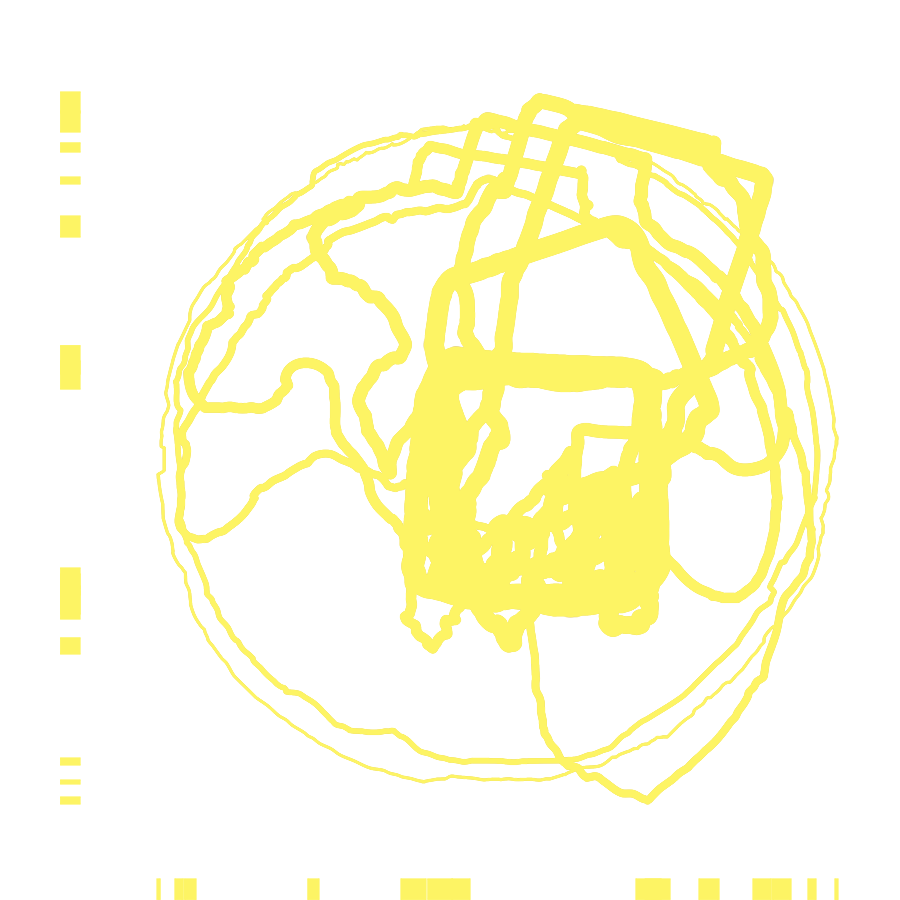
Drawings, phase 3. I selected ten of my butter melting photos to overlay and trace digitally, choosing this method because it allowed me to experiment with different colors, transparencies and line weights in representing the transitional topography of melting. I printed and took these drawings to school to discuss with teammates, classmates, and our TA.
Different people had different reactions, different feelings and preferences. The contrasting responses of a teammate and our TA particularly intrigued me: Both preferred the transparent layers of the far left and right drawings (shown above roughly in order of experimentation from left to right). My teammate found the left one the happiest of the tests, our TA found it the saddest. Considering these different responses, I realized that the far left drawing best evoked the combination of happiness and sadness that I felt while melting (with) the butter. This (unfinished) sketch delineates the dissolving continents of liquid butter with fragile, dark gray outlines. In the final version, the gray fades with the melting butter-continents and my annotations of time intervals between the stages of melting.
I decided to develop this layered approach using digital drawing software rather than hand-drawing. I wanted to make friends with the plotting capabilities at school, and continue experimenting with different layouts. I promised myself that I could hand-trace the layer outlines after printing, and hand-write annotations of the melting process. These hand markings would give the drawing a more personal expression. But limitations of time and paper choices prevailed. Finding the best combination of printed colors took hours (as always). The school plotters' bond paper was too thin and flimsy (for this image), the glossy (which I stuck with) wouldn't accept pencil at all (which I wanted to use) or even ink reliably. I couldn't find time to use an off-campus plotter, and other options on campus would have plotted after the deadline (a lesson for future projects).
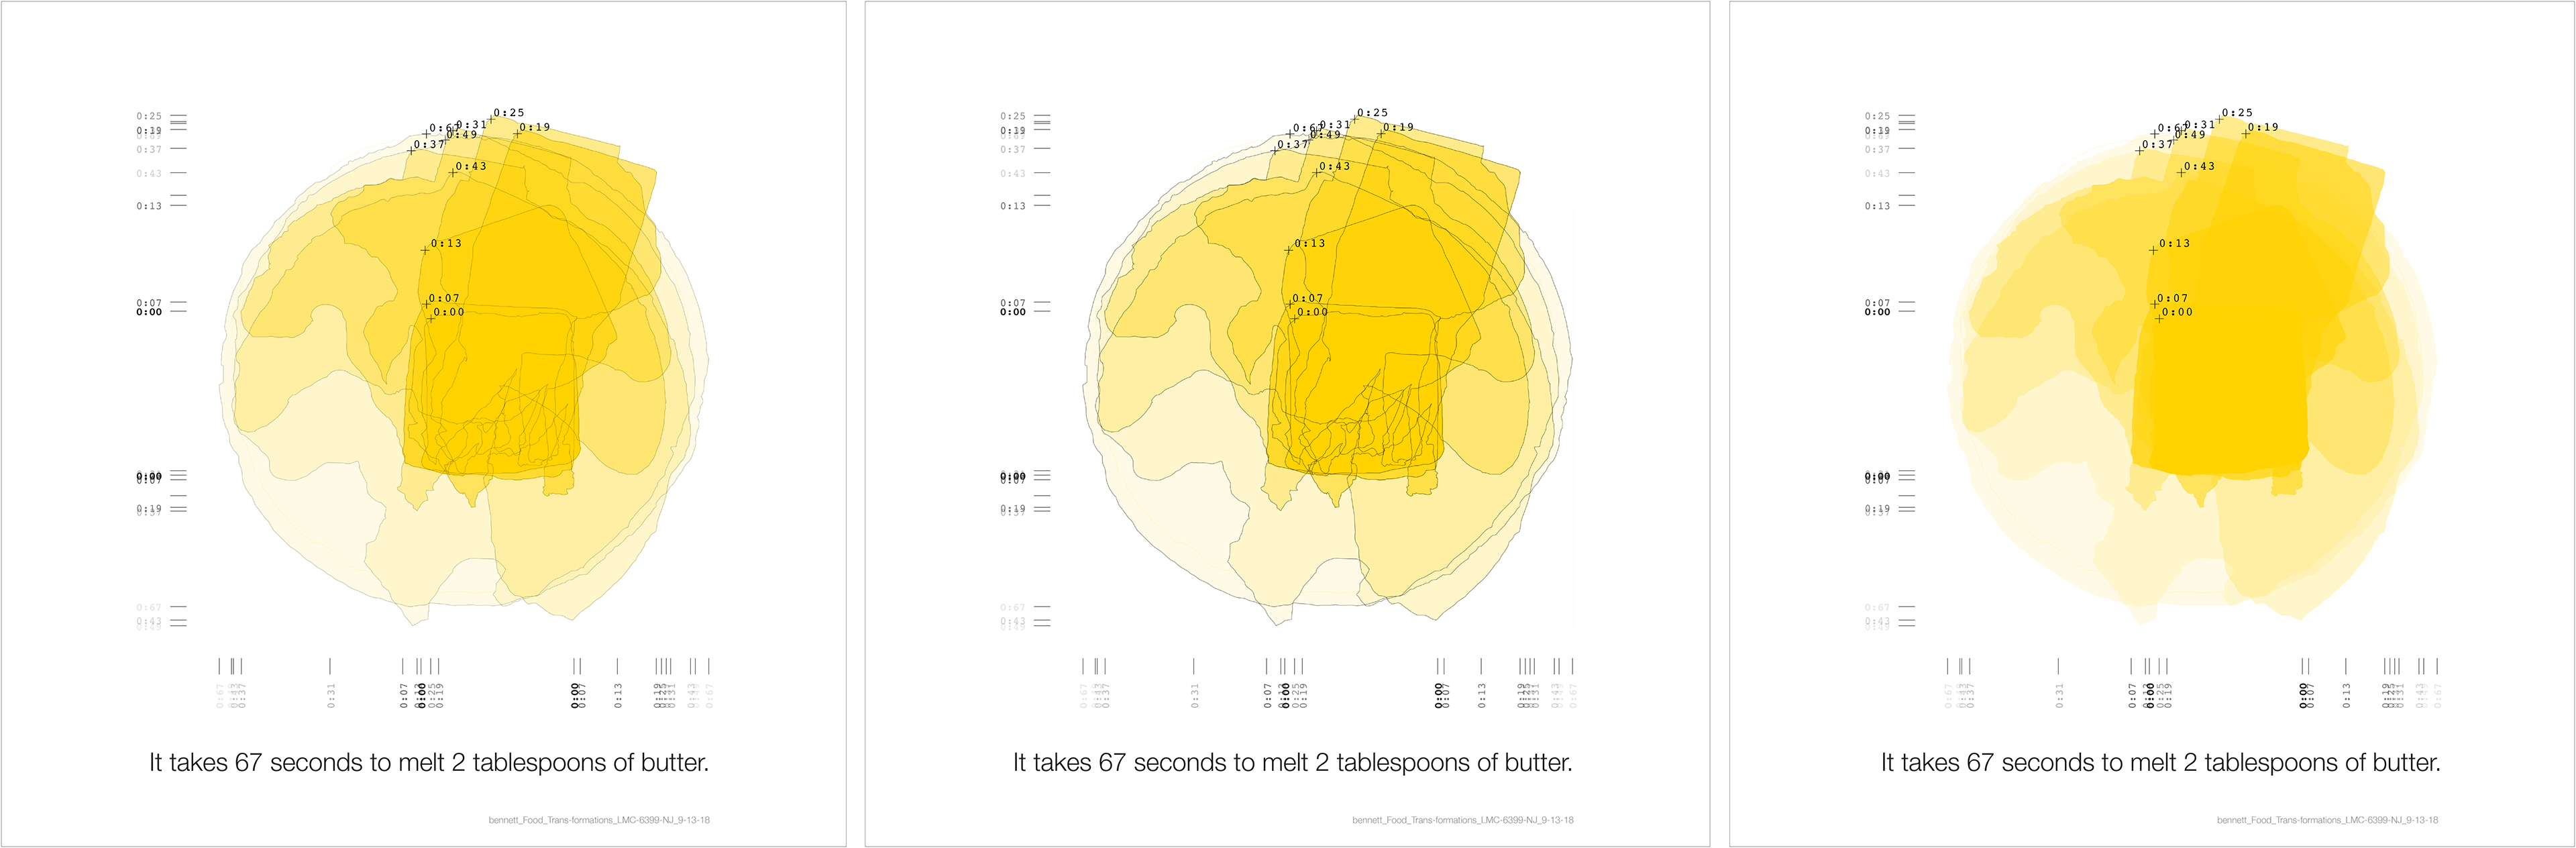
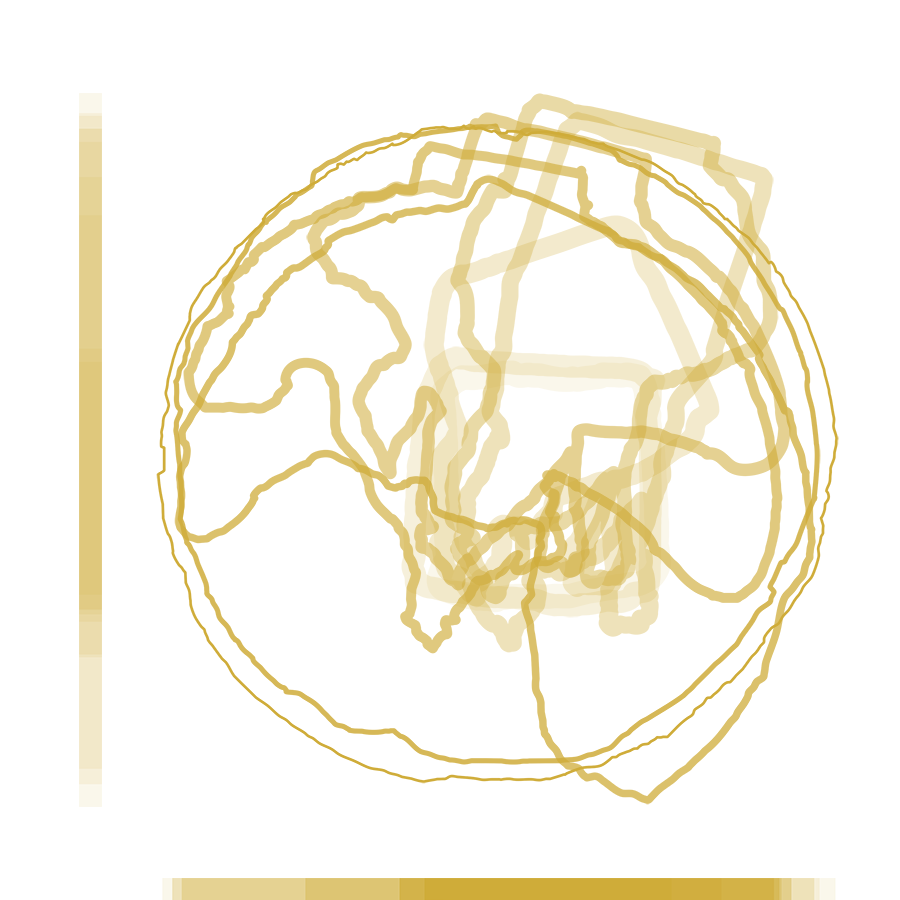
Process stage 5, Katherine Bennett, final drafts. Prints of digital drafts testing different outline options.
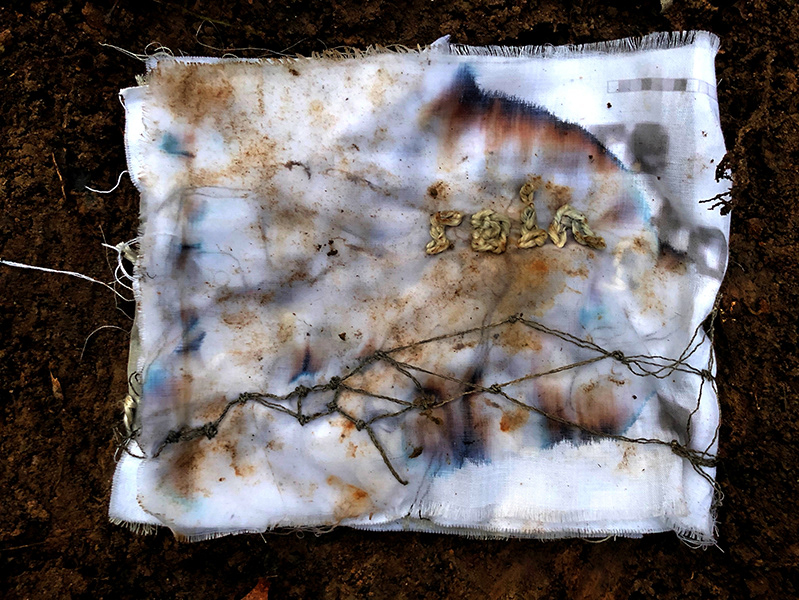
Drawings, phase 4. Many test plots and annotation trials later, I plotted three sets of three drawings on 13.5" x 24" cuts of glossy paper. The most successful three (above) use PANTONE color 116 C (recipe ffd200) with transparent gray outlines. A compromise to time and other deadlines, the glossy paper does convey the butter's liquid, saturated colors. But when time allows I'd like to try developing this drawing as a series of hand-colored and overlaid cut-outs of wax paper (or vellum). I'd also like to try creating the line drawings (phase 3) with knotted rope.
Realizations, final critique. I depended too much on the responses of my TA and teammate (helpful though they were) in deciding on a minimal approach to text. I hoped the simple "It takes 67 seconds...", would communicate a poignant irony when coupled with the fading layers of color and marginal, gray-scaled annotations. The fading outlines and numeric annotations mark the passage of time between each stage of melting. In the final critique, I learned that my minimalistic approach arguably left too much open to interpretation. In this time of "big data," a purely quantitative, science-y reading, stripped of feeling, is too easily assumed. In returning to these drawings, someday, I'd like to address this concern by working more with the materials of representation, starting with wax paper (and/or vellum) and -- maybe -- (melt-able) wax crayons. With this change of drawing media, I'll try cotton or flax fiber rope to convey the tangled quality suggested by my outline-only drawing trials.