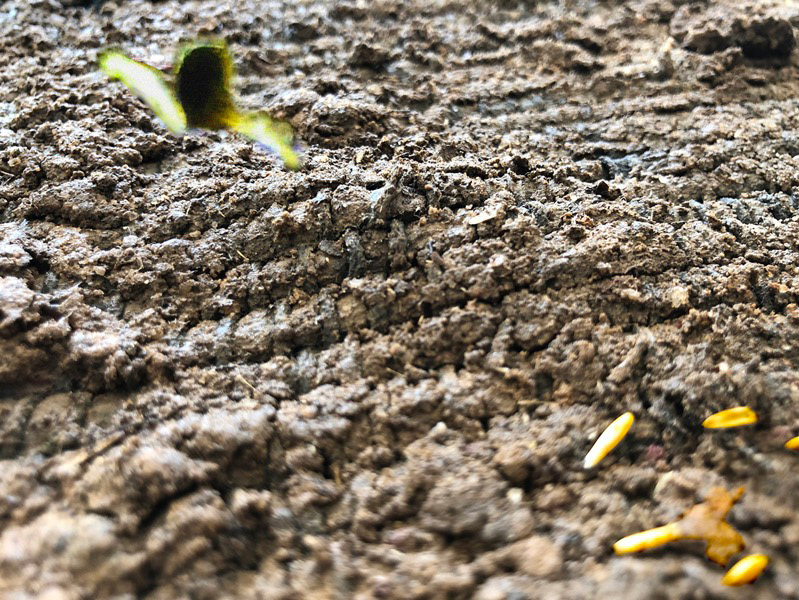
Map collage detail. This and all artwork on page by Katherine Bennett except as noted.
Science & Technology Studies (STS) Studio on "Smart Cities"
Dr. Nassim Parvin
Individual Project
8 January - 30 April, 2019
Different orientations towards time and space, different positioning within time and space, and different systems of language for making space and time "real" underpin notions of past and present, of place and of relationships to the land (Tuhiwai Smith 2012, 57).
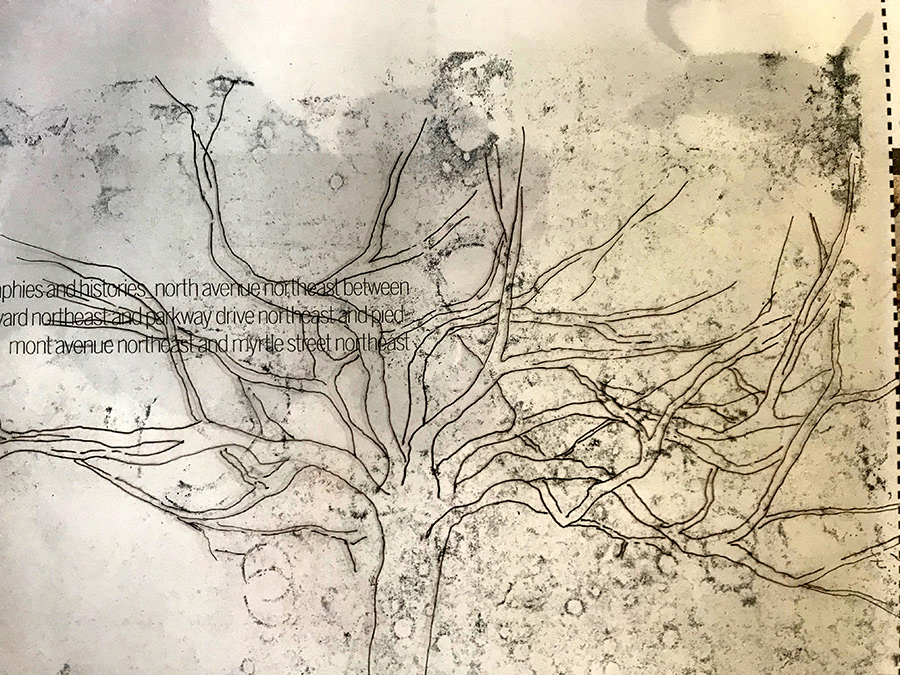
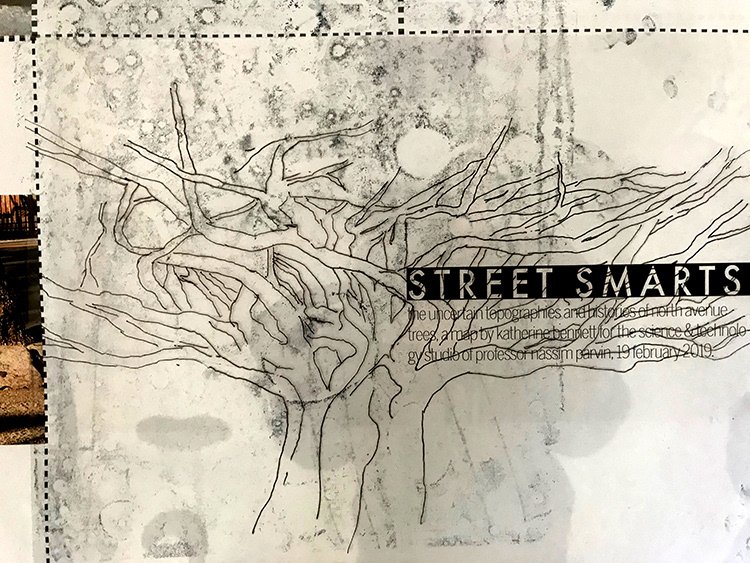
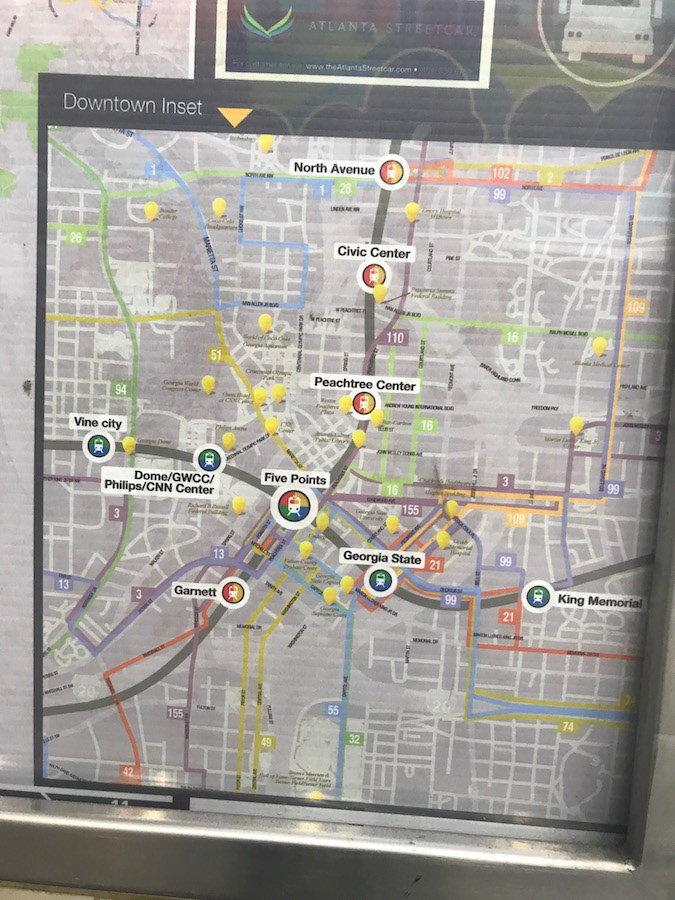
Mapping different IQ's along North Avenue. In this project, I'm looking for ways to map quotients of intelligence not considered in digital, Smart Corridor technology. "Smart" technology maps city streets as sites of "Internet of Things (IoT) deployment, data collection/analytics, autonomous vehicles, and [unspecified] partnerships." The City of Atlanta is deploying this Smart City technology as a "public demonstration and 'living lab'" along North Avenue, a now-central arterial street that crosses the city's Midtown. Historically, though, the avenue marked the city's northern limits in the mid-19th century time of slavery, cotton, and paper.
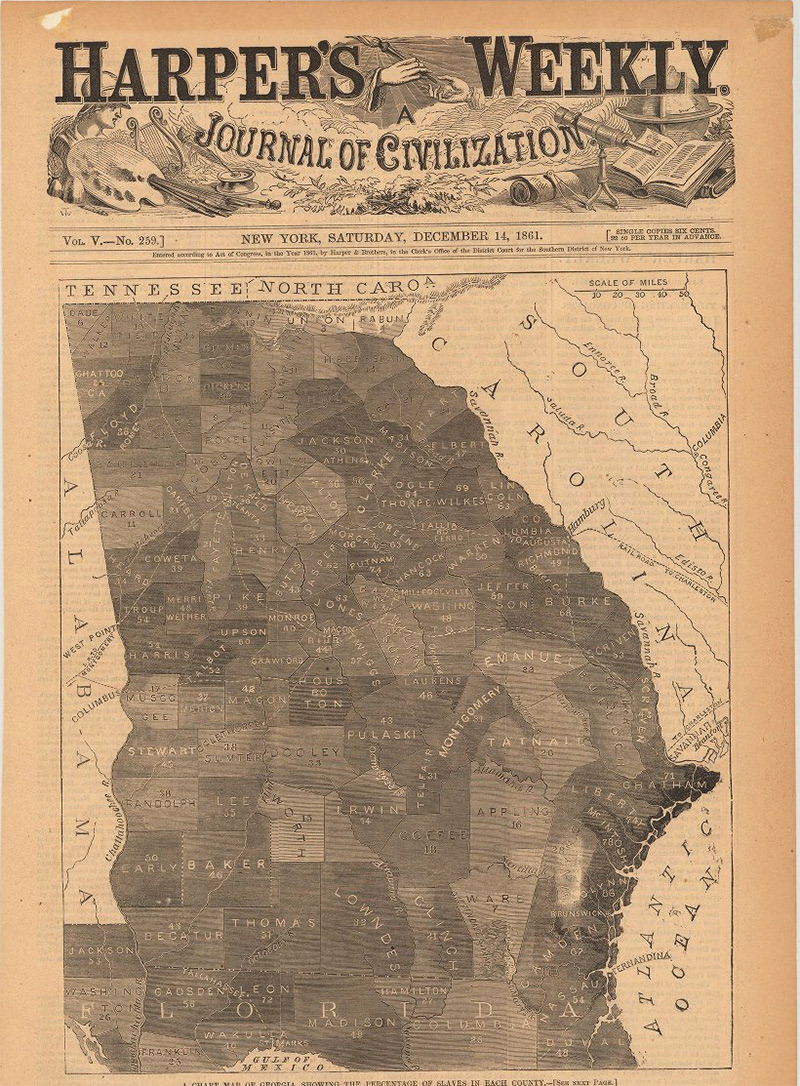
Slaves as percentages of county populations, 1861. Source: https://georgiainfo.galileo.usg.edu/images/uploads/gallery/georgiaslavemap.jpg
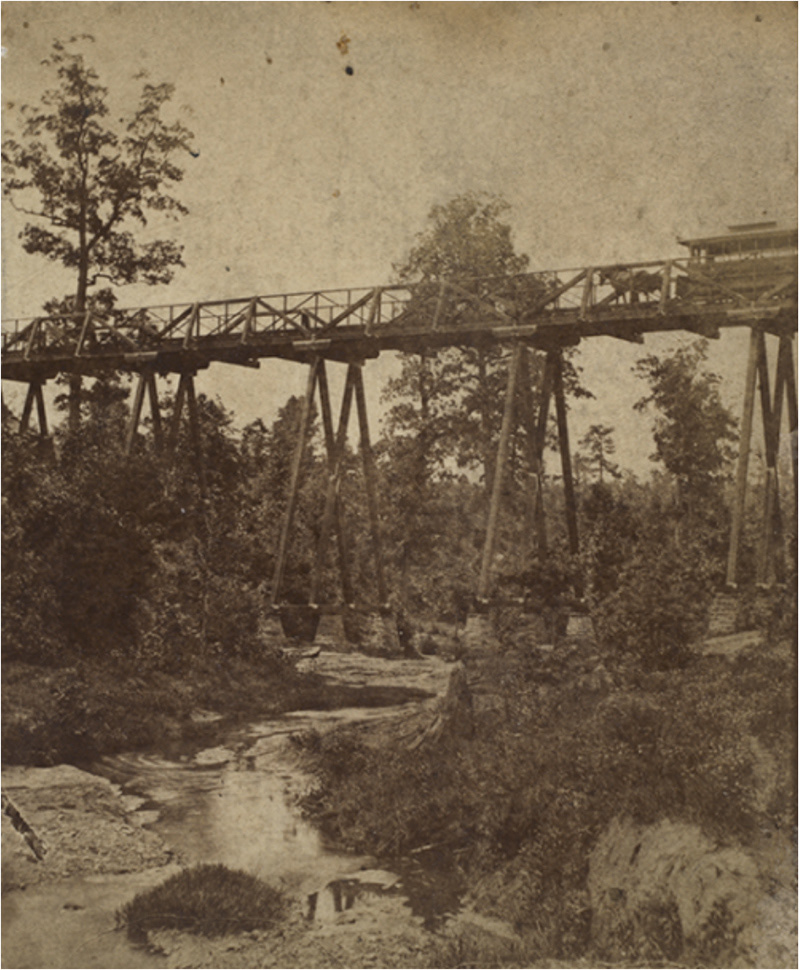
"Intersection of Clear Creek and the Dummy Line of Atlanta Street Railroad Company, ca 1874. It's now where Ponce De Leon Ave meets Penn Ave" (Atlanta History Center). Source: http://album.atlantahistorycenter.com/cdm/singleitem/collection/athpc/id/419/rec/1
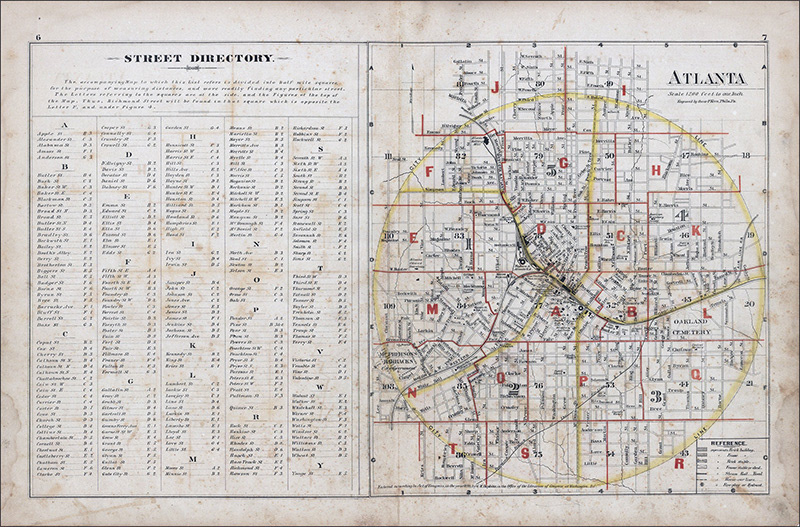
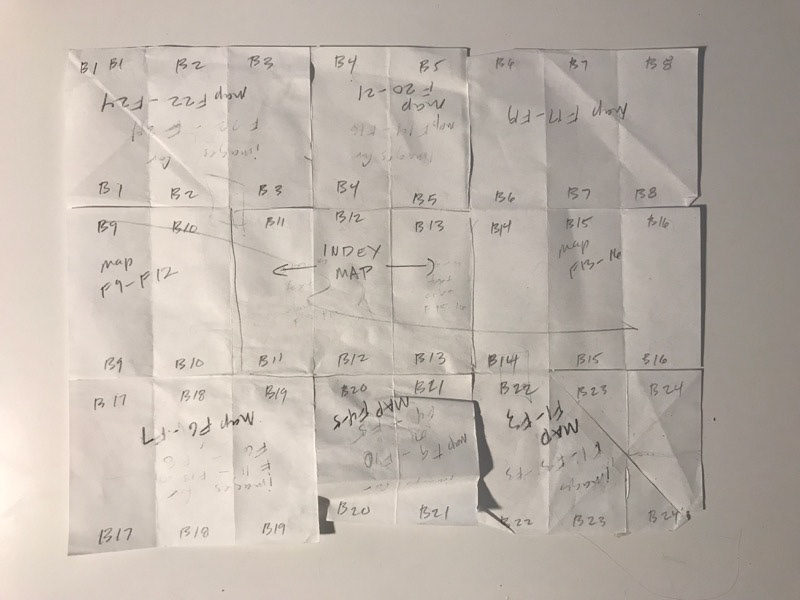
Atlanta City Atlas, 1861. "City Atlas of Atlanta, Georgia: from Actual Surveys and Records. Published for the Southern and Southwestern Surveying and Pub. Co. by G.M. Hopkins, C.E., 1878." North Avenue crosses Plates I and J, centered in the half-mile squares of map grid row B. Source: Emory University, http://www.digitalgallery.emory.edu/luna/servlet/s/5pv3t0.
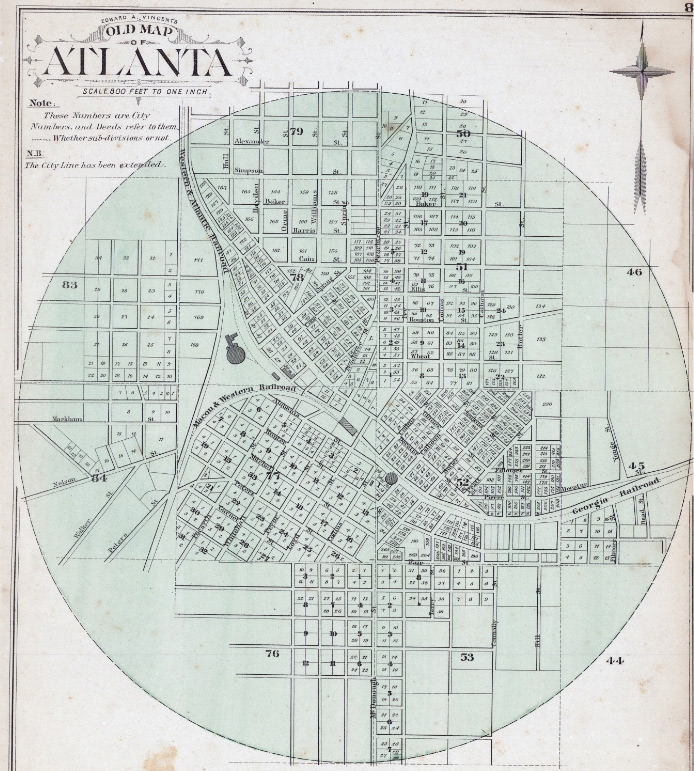
"Old Map" of Atlanta, 1878. Source: Emory University, http://disc.library.emory.edu/atlantamaps/1878-overview/
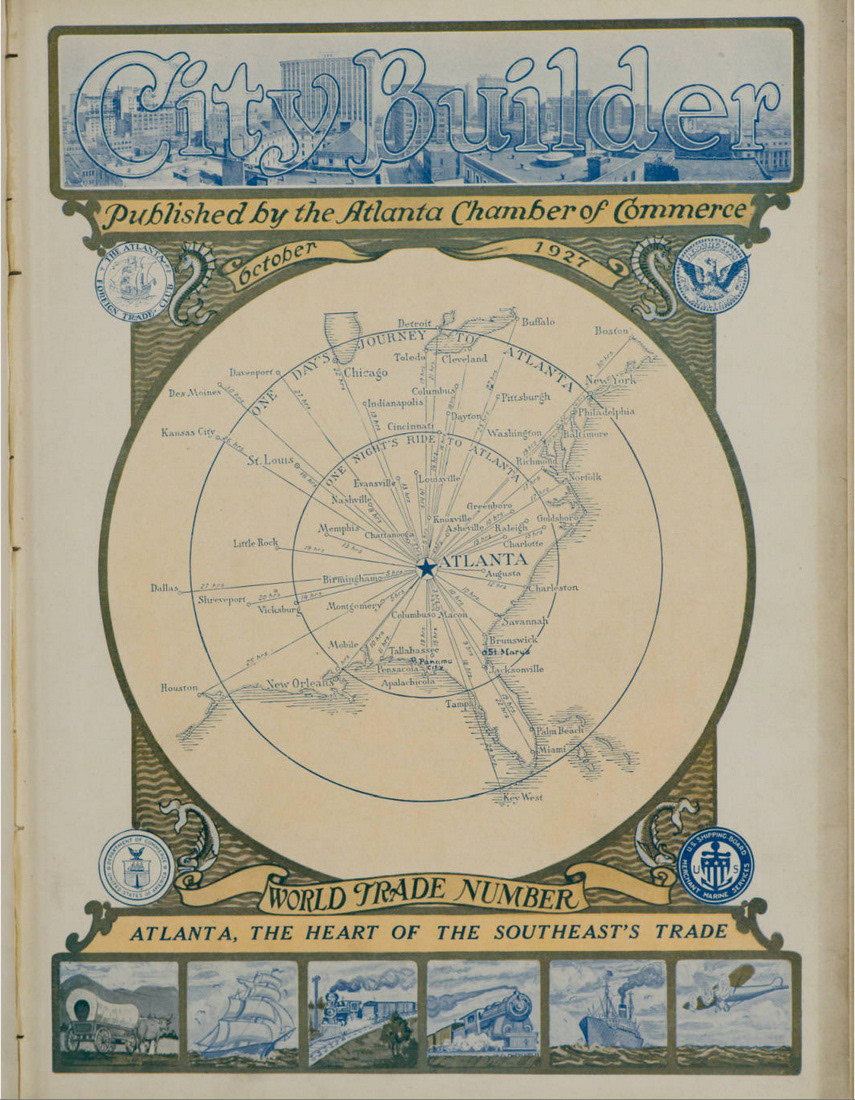
Cover of the "City Builder" magazine, 1927, published by the Atlanta Chamber of Commerce. Source: Atlanta History Center: http://album.atlantahistorycenter.com/cdm/fullbrowser/collection/ACBuilder/id/5908/rv/compoundobject/cpd/5976/rec/35
"Historic maps" and a photo of Atlanta and Fulton County from the mid 19th through the early 20th century. County map far left quantifies the enslaved population in 1861. Photographed and archived in Atlanta. Click on images for details and sources.
Boundaries that warp. Despite the city's growth since 1900, North Avenue remains a boundary. The street still limits, twists, and warps the lives of its occupants (Bowker and Star 1999). But these occupant trees and people and myriad other living beings along the avenue also have the street smarts to push back against this boundary, effectively warping it as it warps them. So a central question that I brought to the project is: How can I map these street-smart, rebound warps of the avenue (Bennett 2018)? Looking back on the project (thus far), my question has become more specific: How can I warp historic forms of mapping to recognize different kinds of intelligence at work in making North Avenue what it is, has been, and could become (hooks 1991, Haraway 1988)?
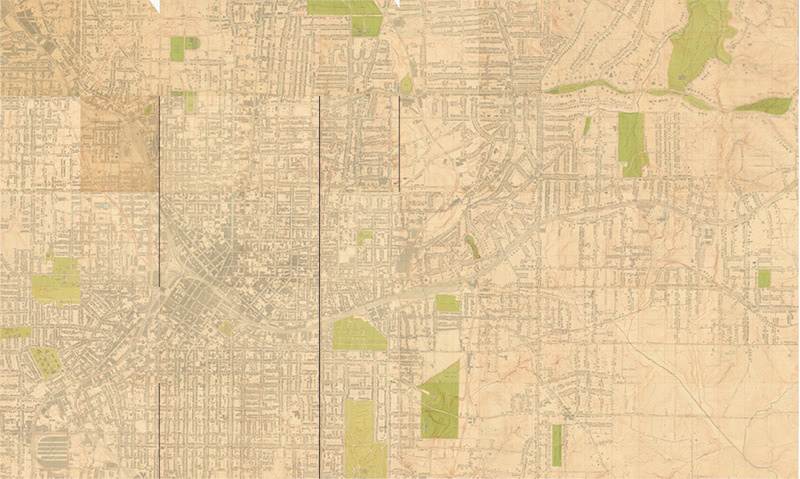
Atlanta topography, 1928. Source: http://disc.library.emory.edu/atlantamaps/1928-atlanta-city-map/
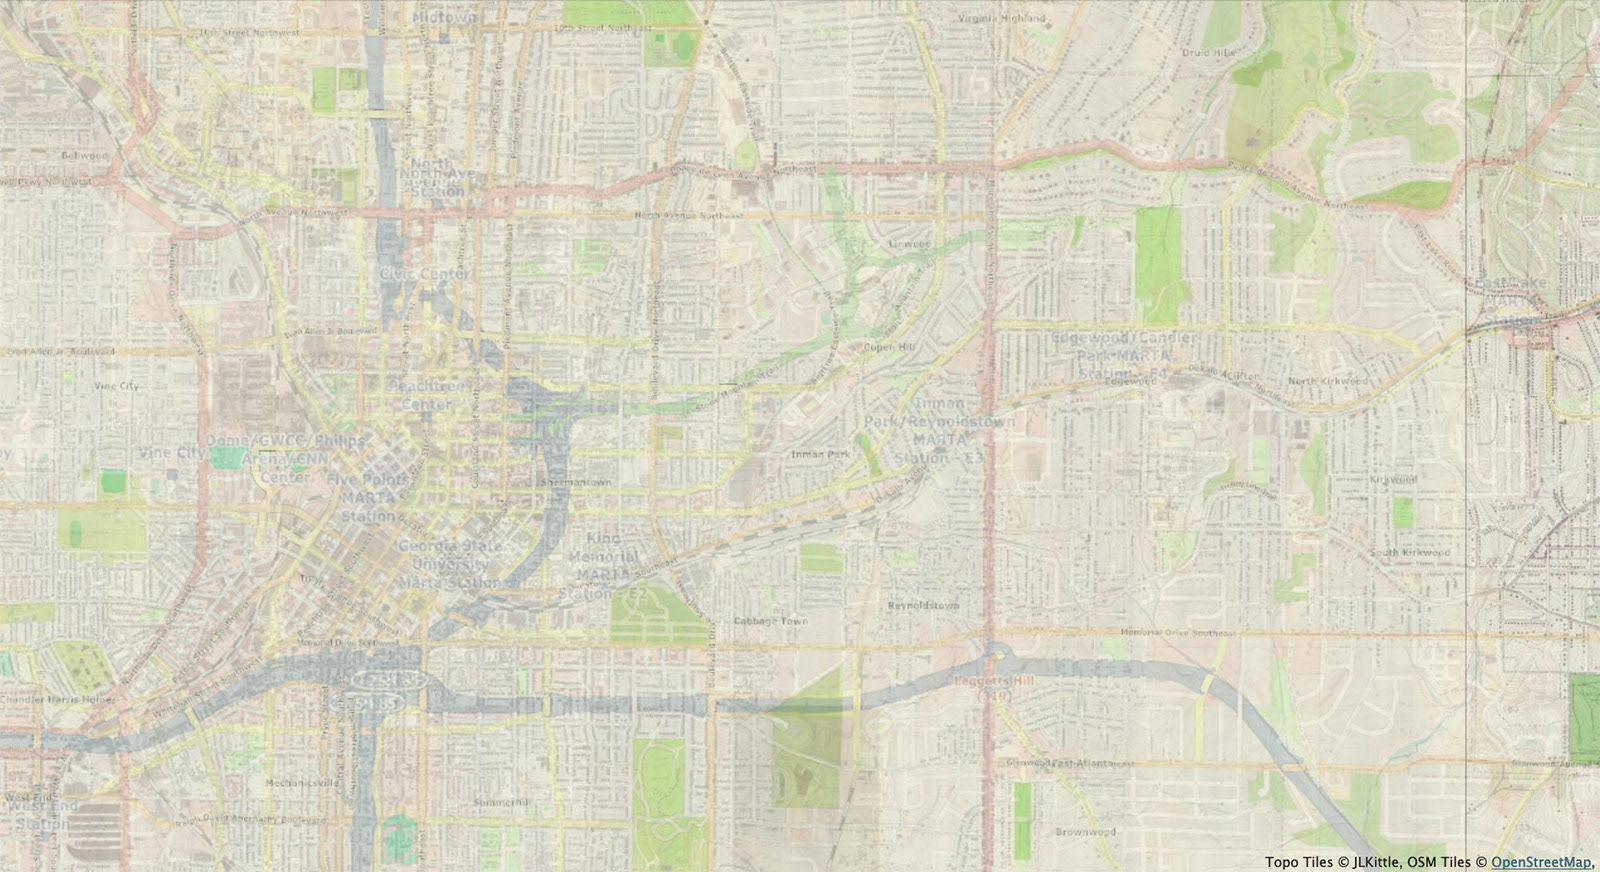
Open Street Map Overlay on 1928 topography map, 2013. Source: http://disc.library.emory.edu/atlantamaps/atlanta-1927-30-topographic-maps-with-open-street-map-overlay/
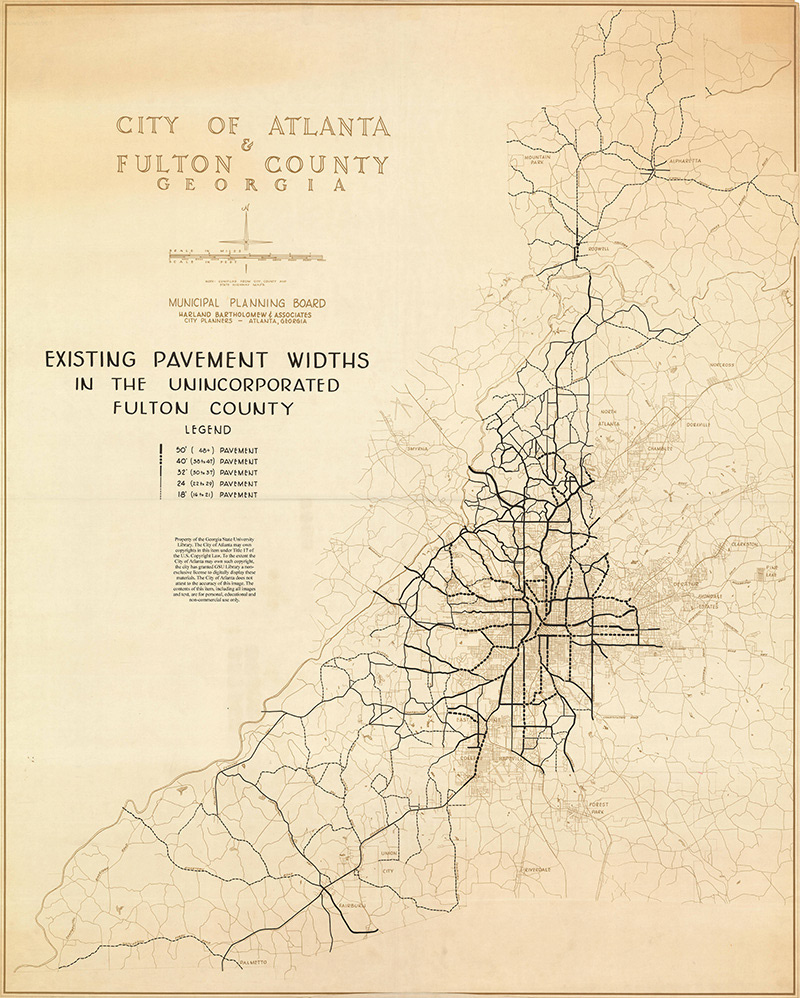
Map of pavement widths in Atlanta and unincorporated Fulton County, n.d. Source: Georgia State University, http://digitalcollections.library.gsu.edu/cdm/singleitem/collection/atlmaps/id/171/rec/6
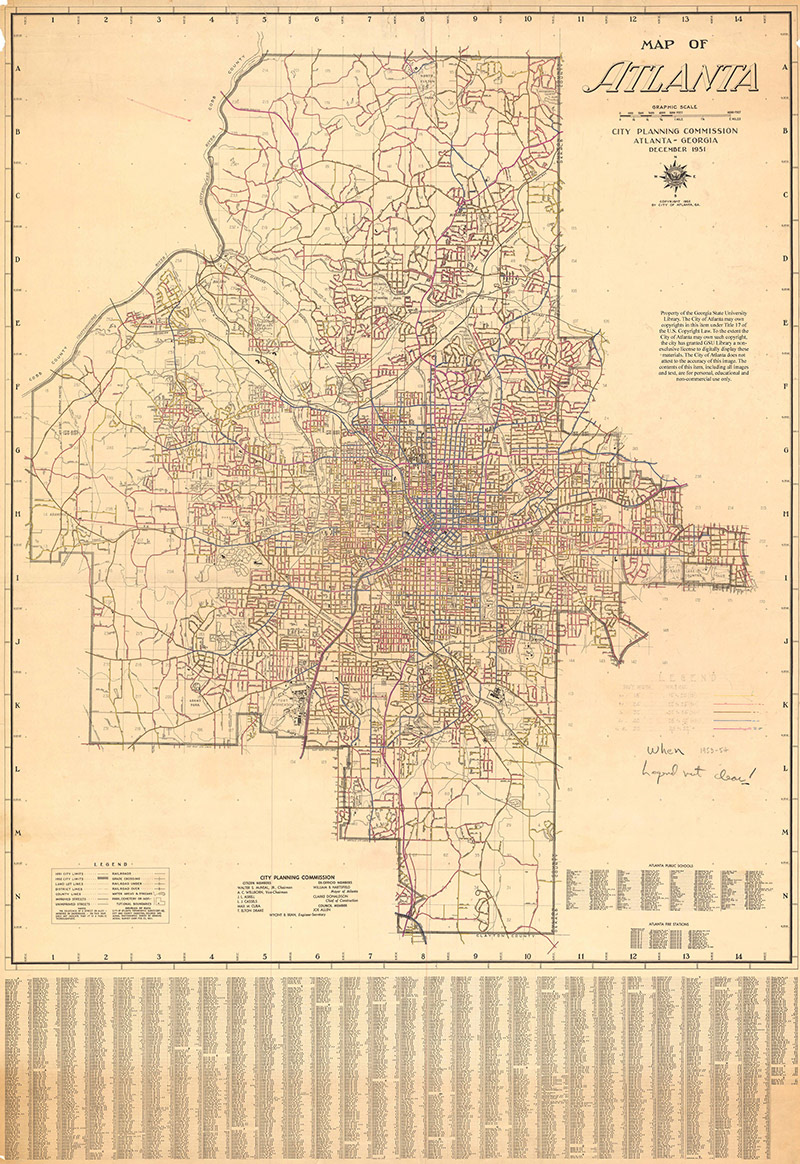
Map of pavement widths in Atlanta and unincorporated Fulton County,1951-1952. Source: Georgia State University, http://digitalcollections.library.gsu.edu/cdm/singleitem/collection/atlmaps/id/1864/rec/3
"Historic maps" of Atlanta and Fulton County from the early 20th through the mid 20th century. Two county maps far right, represent street pavement widths in the 1950's. Maps photographed and archived in Atlanta. Click on images for details and sources.
Uncertain topographies and histories. These two ways of mapping cities in relation to their topographies and histories are intertwined. Maps represent the not-flat terrains and unfolding pasts we navigate. By looking back to these uncertain material and temporal grounds, maps also look forward, suggesting patterns of change that might—or might not—continue. Yet the moment they're made, maps become history. Paper maps tend to show their age in stained and torn, folded and wrinkled surfaces. Digital maps, seemingly surface-less, will likely come to show their time travels in other attributes shared with printed maps: encoded graphic and typographic styles, and their snapshots of the different and changing situations that create histories (Haraway 1988).
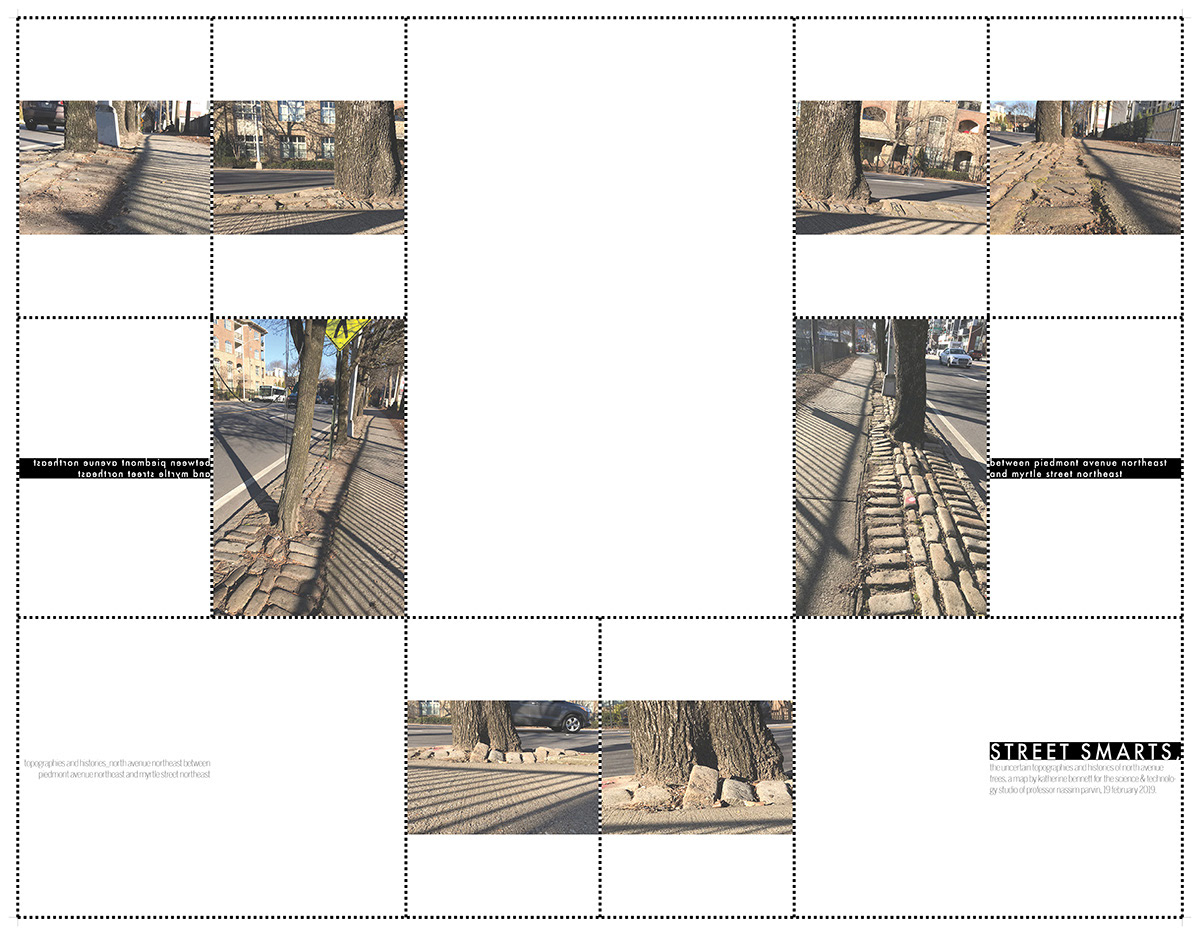
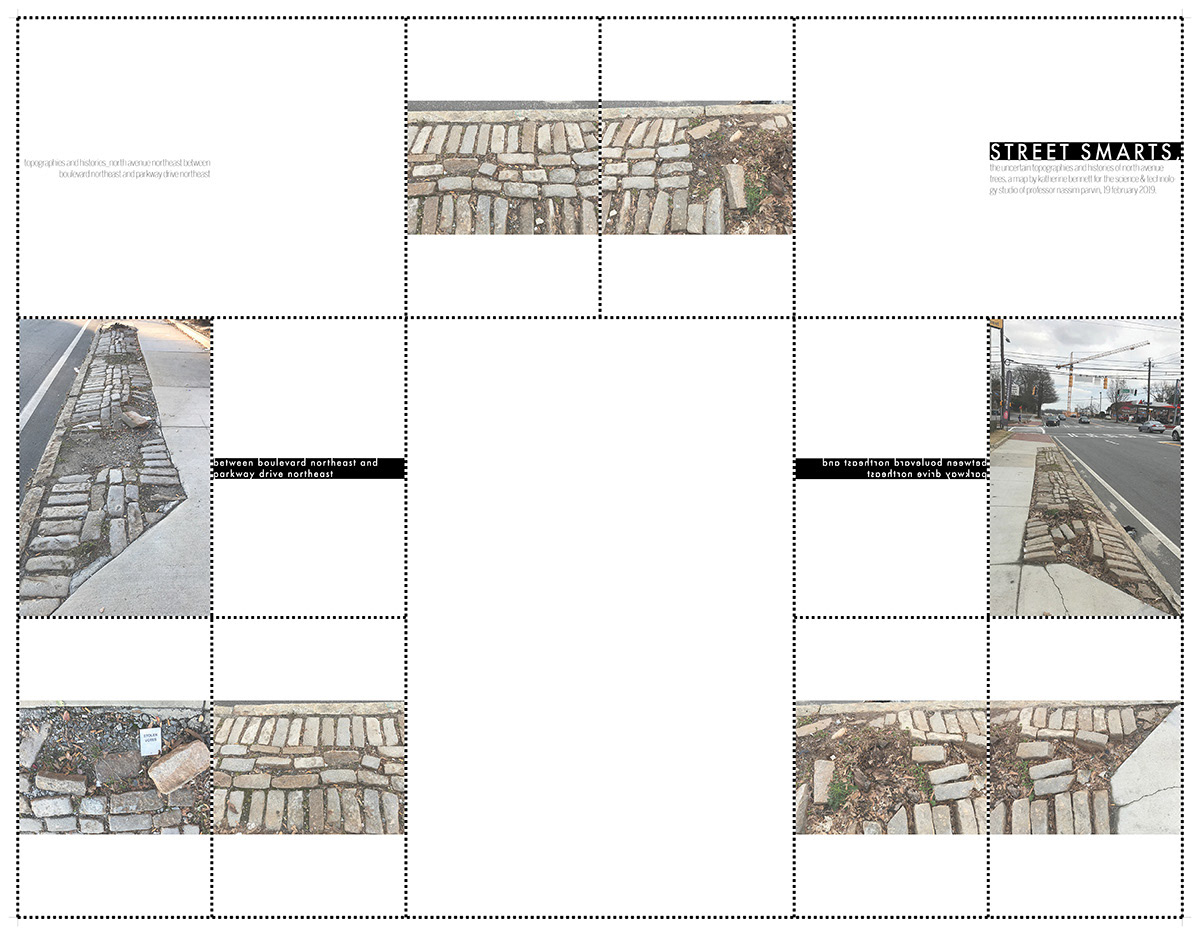
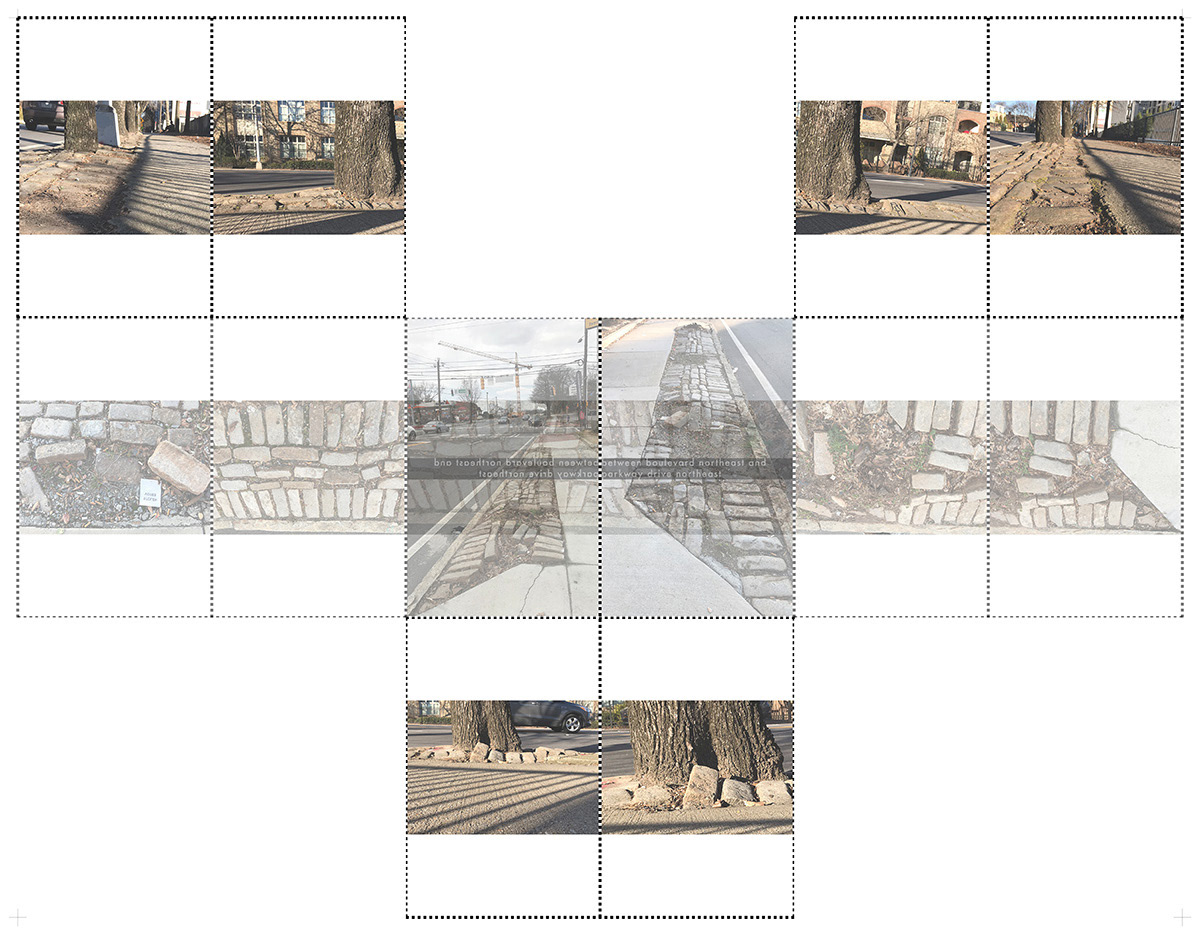
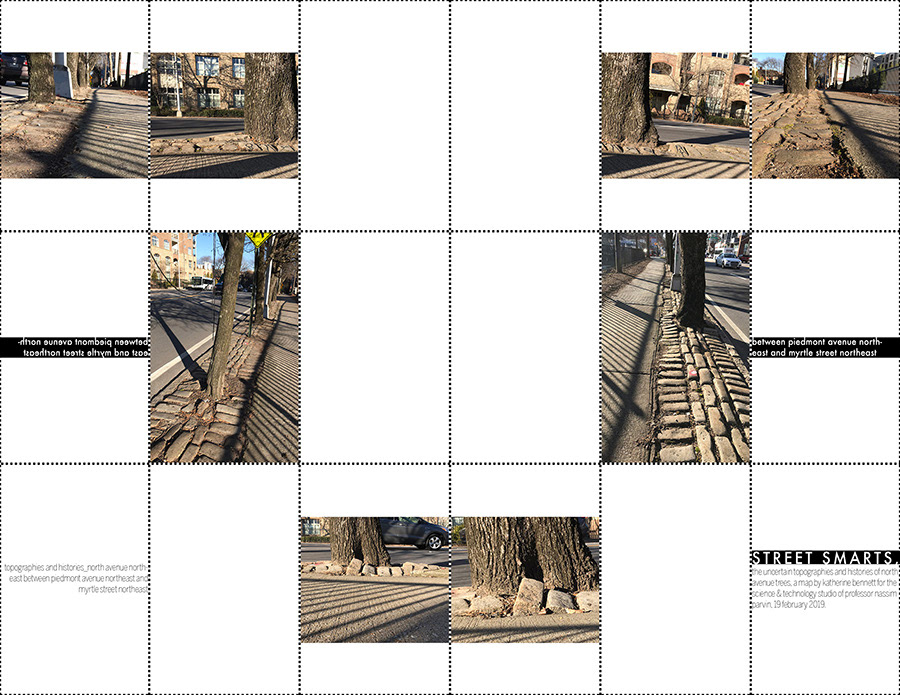
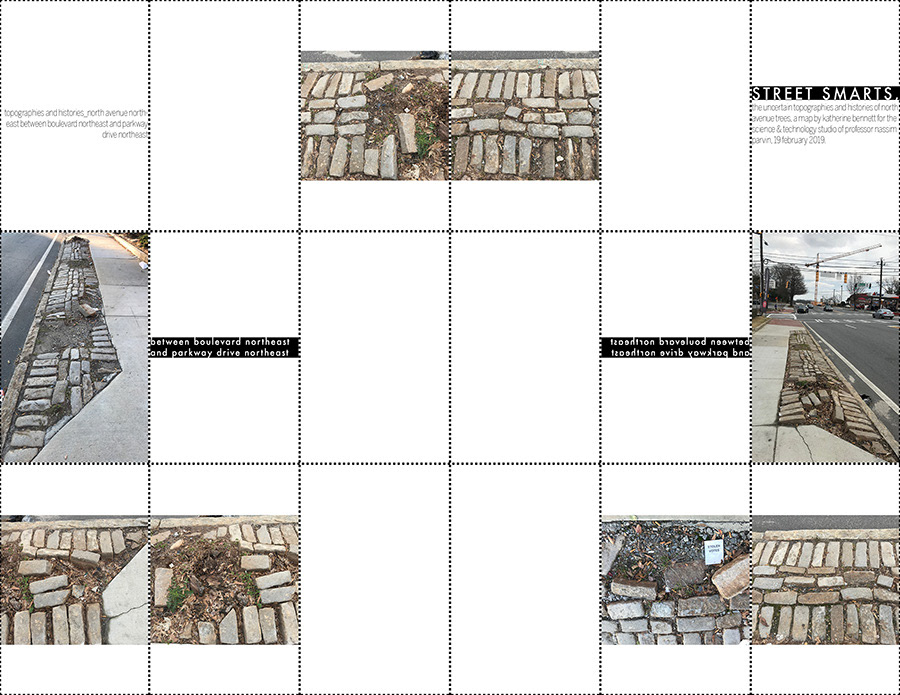
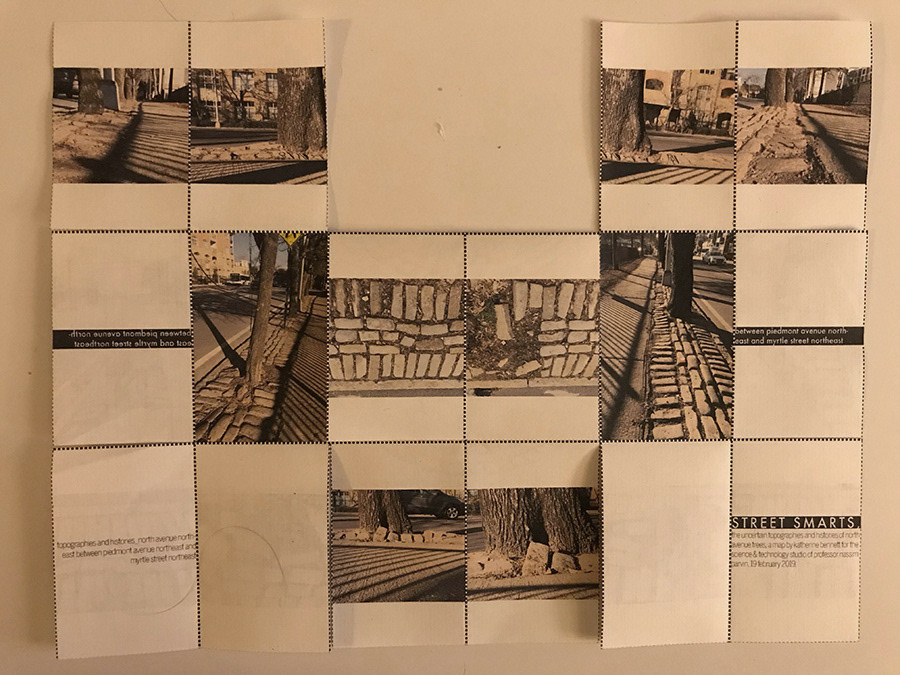
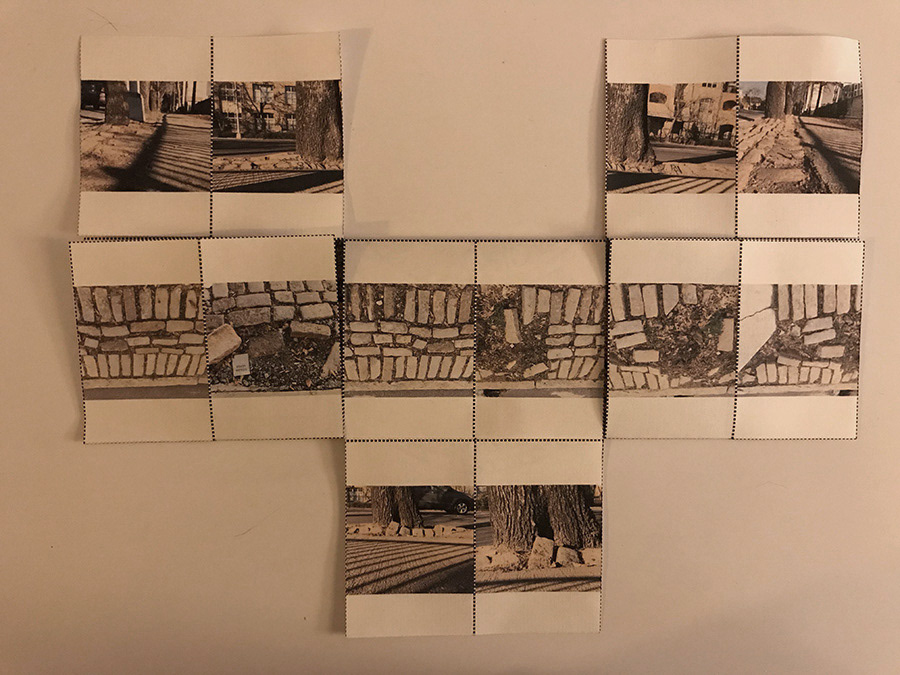
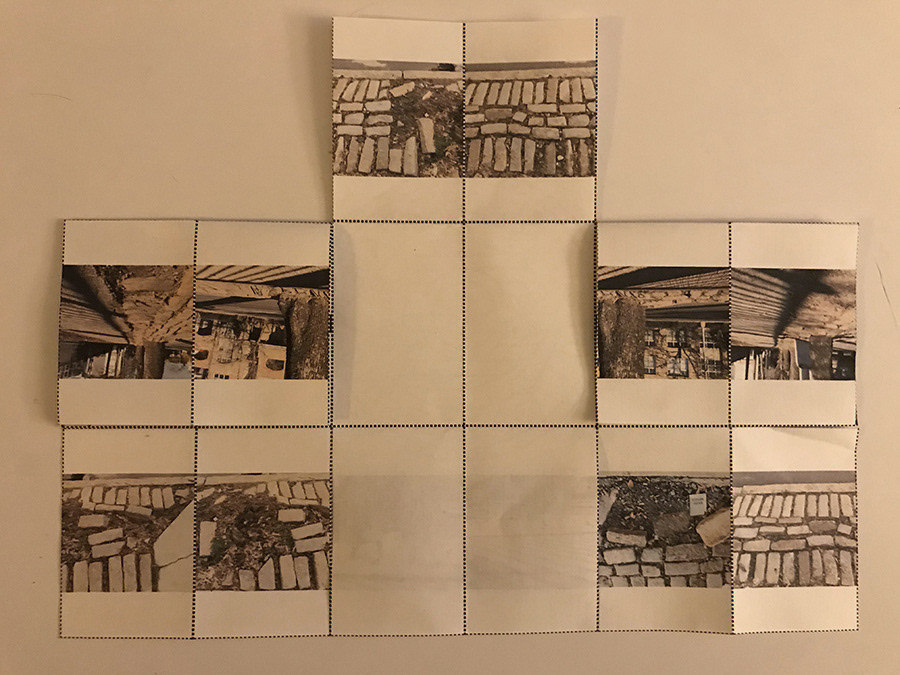
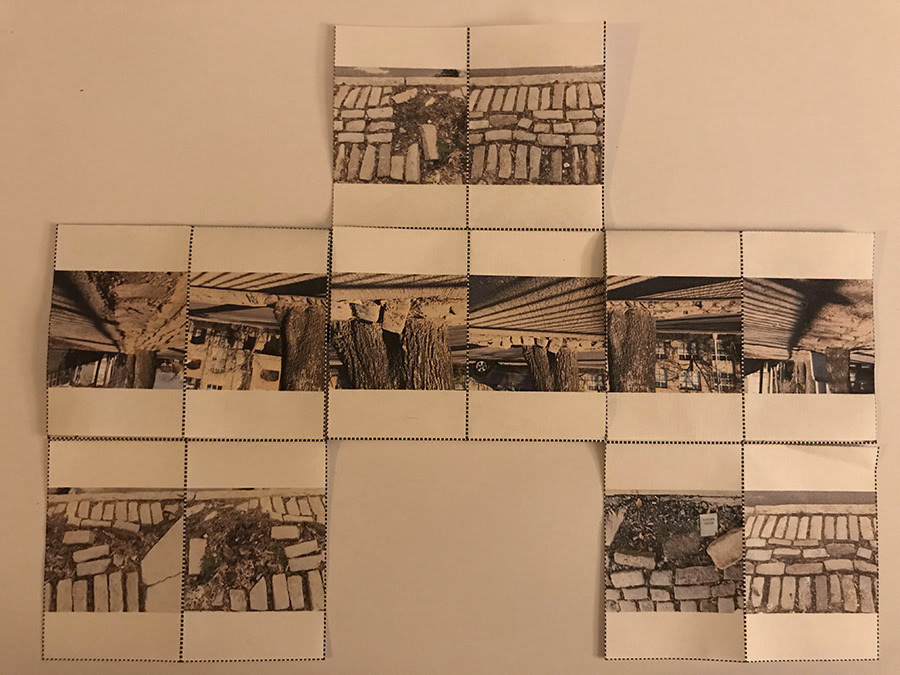
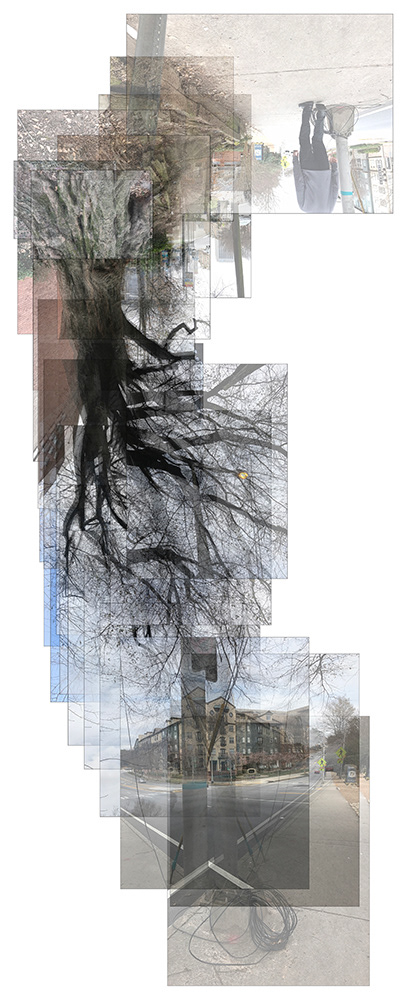
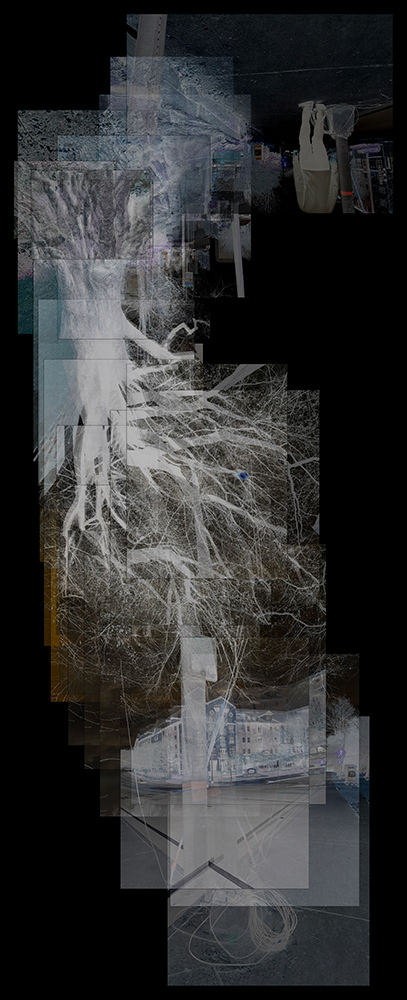
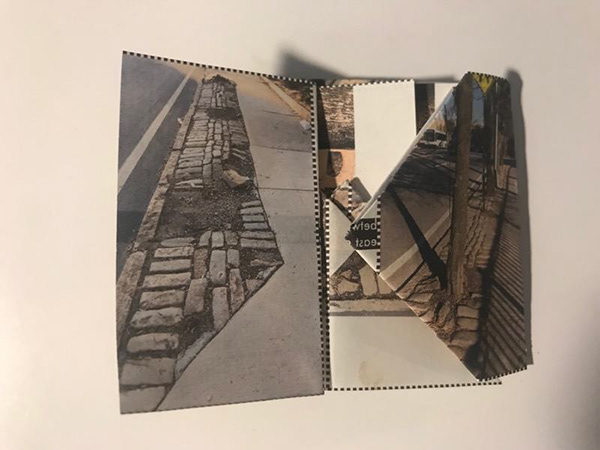
Printed digital photos represent topographies and histories of North Avenue embodied in street trees, warped and broken pavements, communication and power lines, and the smart city cameras these lines empower.
See preceding image caption for description of photos. Here, yellowish stationary paper of the folded, letter-sized maps contrasts with the wax-coated, bright-white of the plotter paper on which the folding diagrams and their trimmed margins were printed. The tangle of these trimmed margins refers to the entanglement of living tree roots with each other and with people.
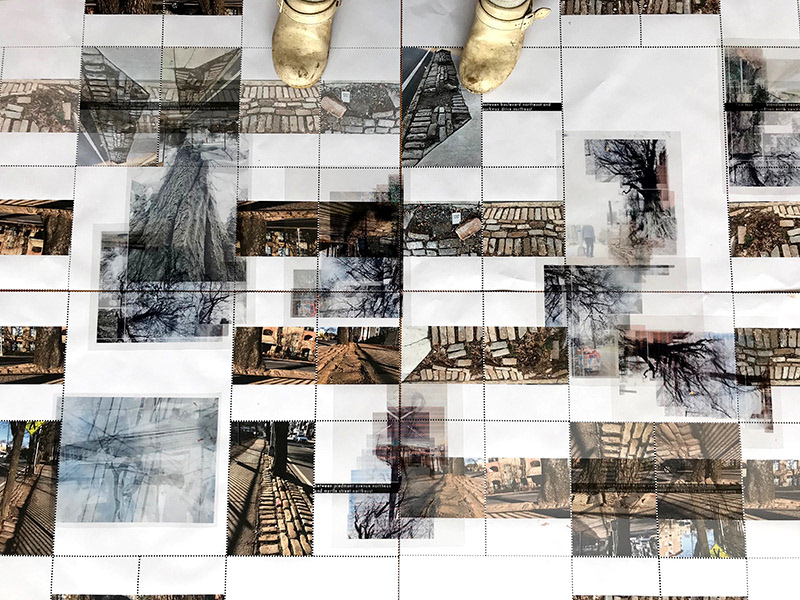
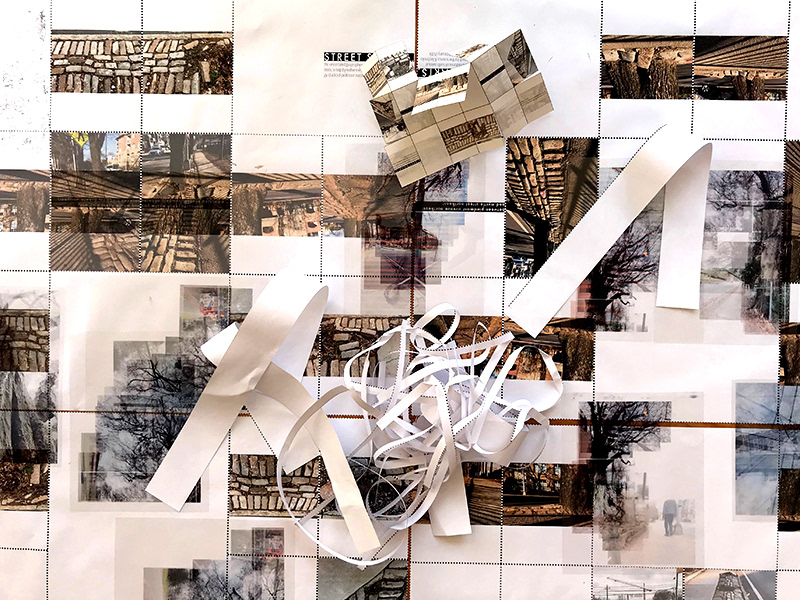
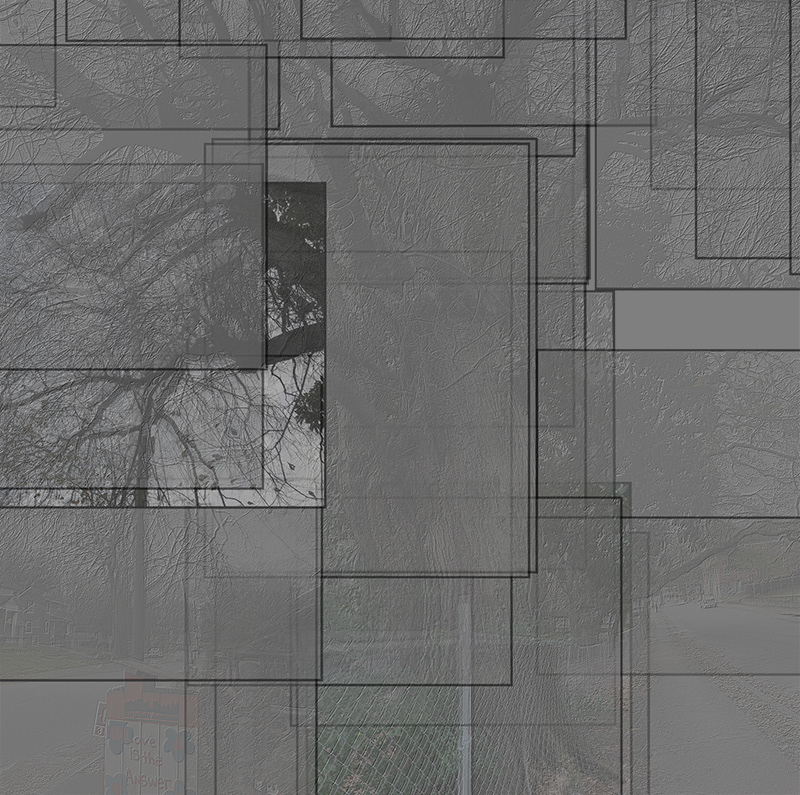
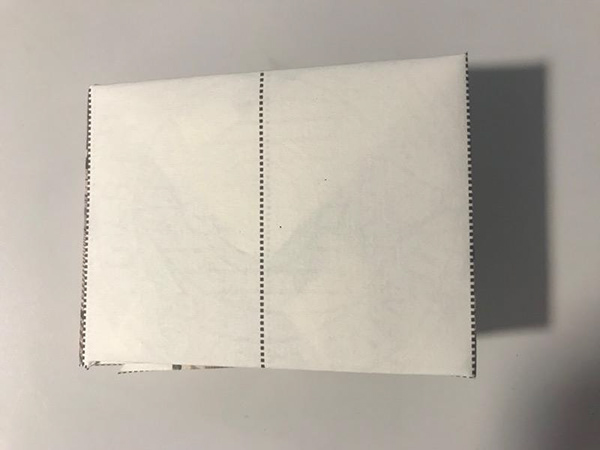
left, Printed 25.5" x 33" diagrams of photo-based "maps" with moveable transparent overlays that also incorporate photography (see composite digital photo-collages below). right, Same, with the addition of letter-sized (8.5" x 11"), cut and folded paper maps, and tangled margins trimmed from the printed diagrams. Click on images for detailed descriptions. Digital photos, maps, and map diagrams created and printed in Atlanta. Assemblages of printed maps, map diagrams, and acetate overlays photographed in rural Georgia.
People and feet. Maps can't keep up with the always changing grounds of city streets and sidewalks. But feet can. Feet re-map cracks in the concrete, lumps in the asphalt, fallen leaves and oil stains, even as they participate in wearing down and rebuilding these surfaces over time. Our feet know and map the warped topographies and histories of cities with more active, specific, and material intelligence than paper and digital maps.
Digital map diagrams representing different effects of folding the letter-sized maps. Digital photos and drawings created in Atlanta.
Trees and roots. Trees don't have feet, and don't appear to move around of their own accord. But trees do have roots, and roots move. Roots move themselves, like feet, for not dissimilar reasons (work, communication, community, space to live and breathe). Underground, they transport the air, water, and food/nutrients on which they and we depend. Roots also move asphalt, concrete, cobblestones, and curbs with greater material effect than feet. Certain old and wise trees in this city have been pounding its pavements far longer than the feet of Atlanta's most senior human citizens. You could say that, in some ways, roots know and map the changing topographies and histories of the city even better than feet do. Certainly, roots have a more intimate relationship with the ground. They live in and on it. They warp it. They don't wear shoes.
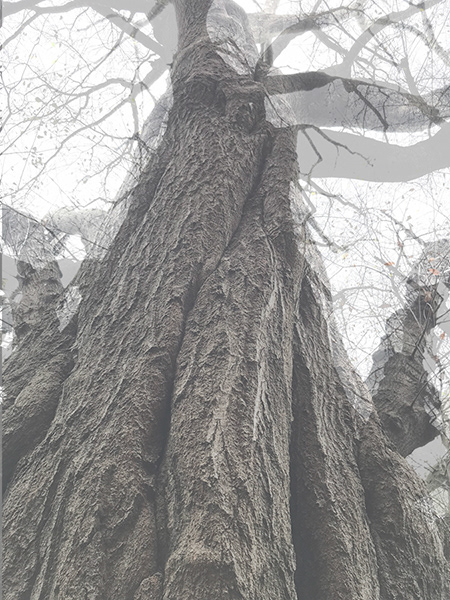
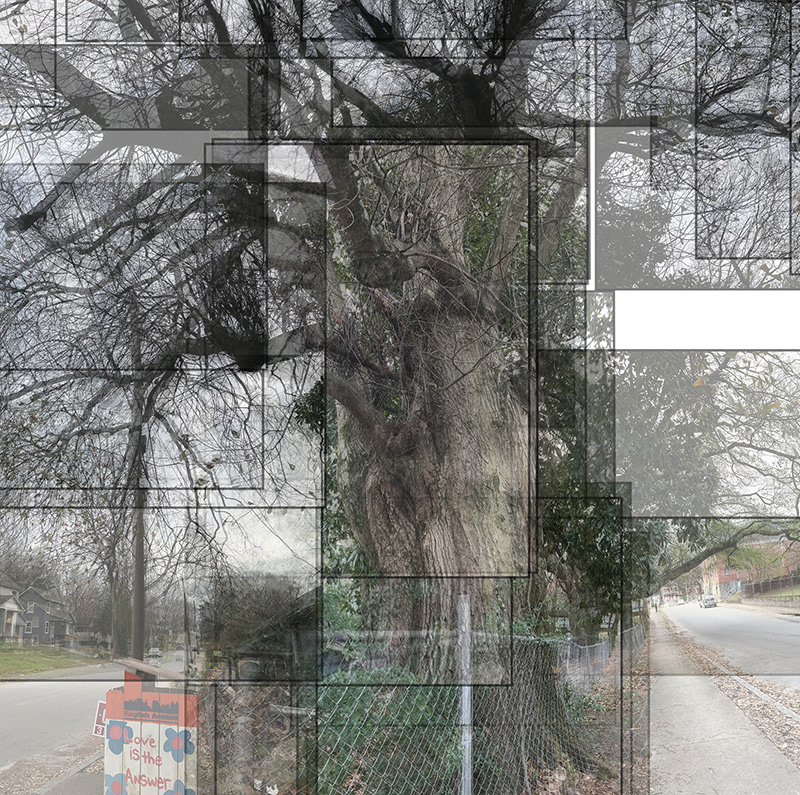
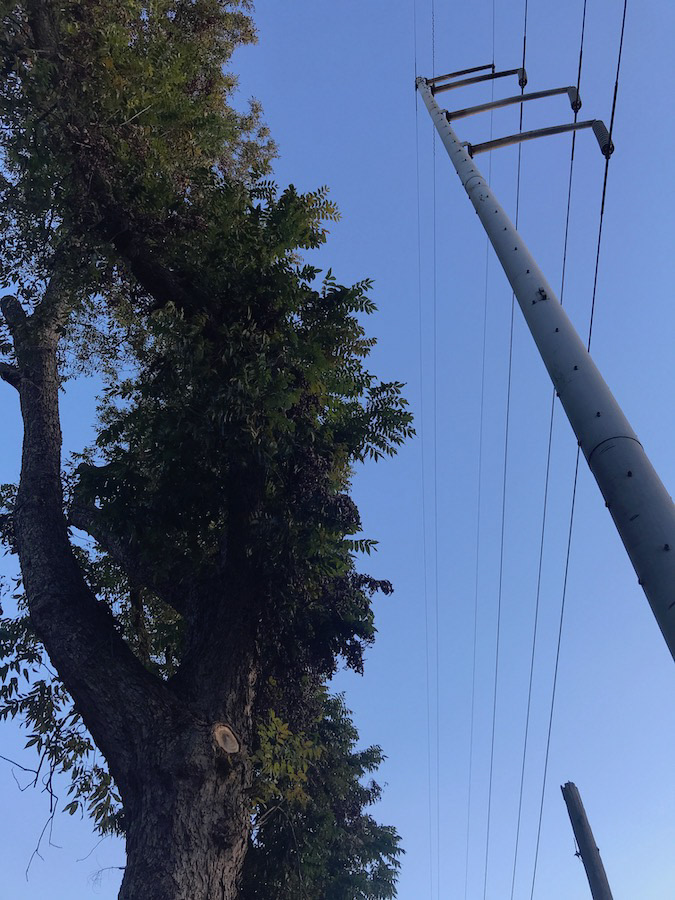
Large, old oak tree on North Avenue between Myrtle Street NE and Penn Avenue NE.
The same tree with utility lines and pedestrians.
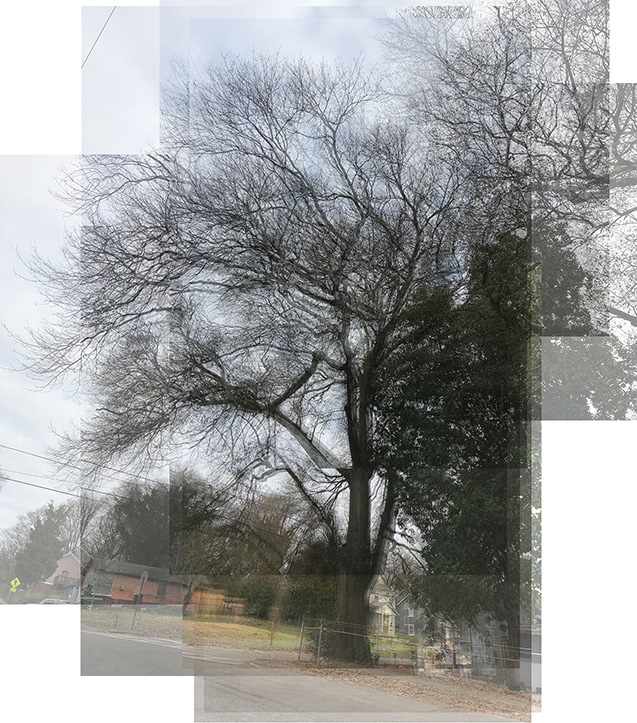
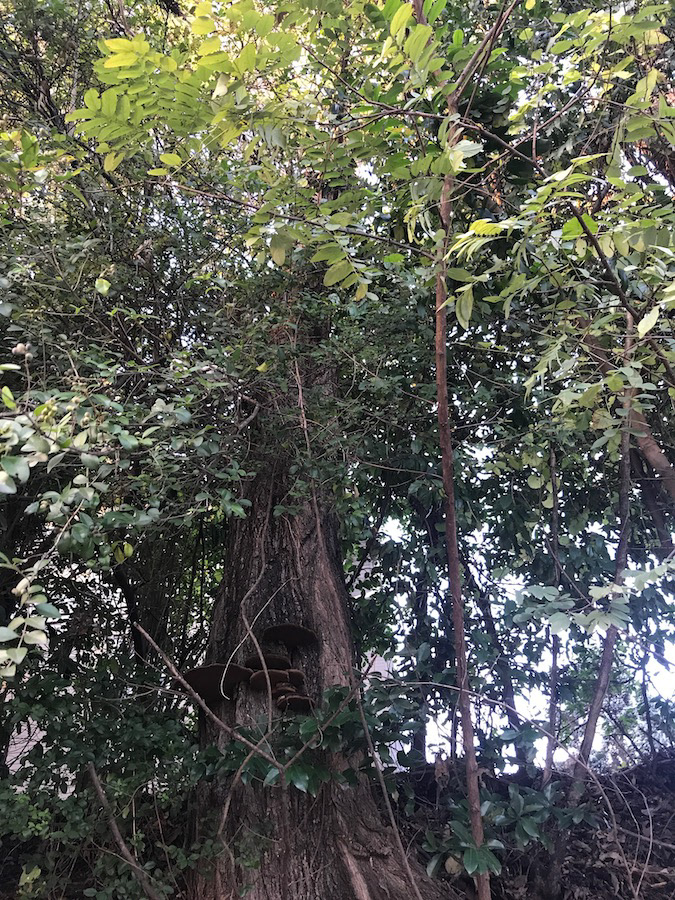
Larger, less severely pruned, old oak tree at the intersection of North Avenue and Oliver Street NW.
The same tree at Oliver St., taken from different angles and positions.
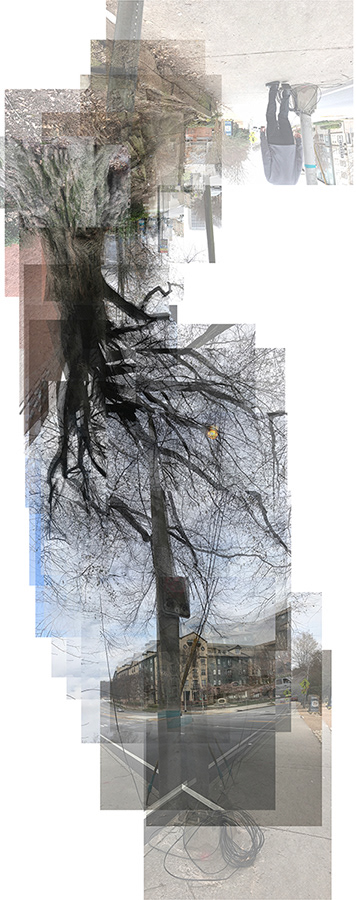
Communication and power lines and "Smart Corridor" cameras at the intersection of North Avenue and Boulevard NE, near a line of former tree locations shown in the folded maps and their folding templates.
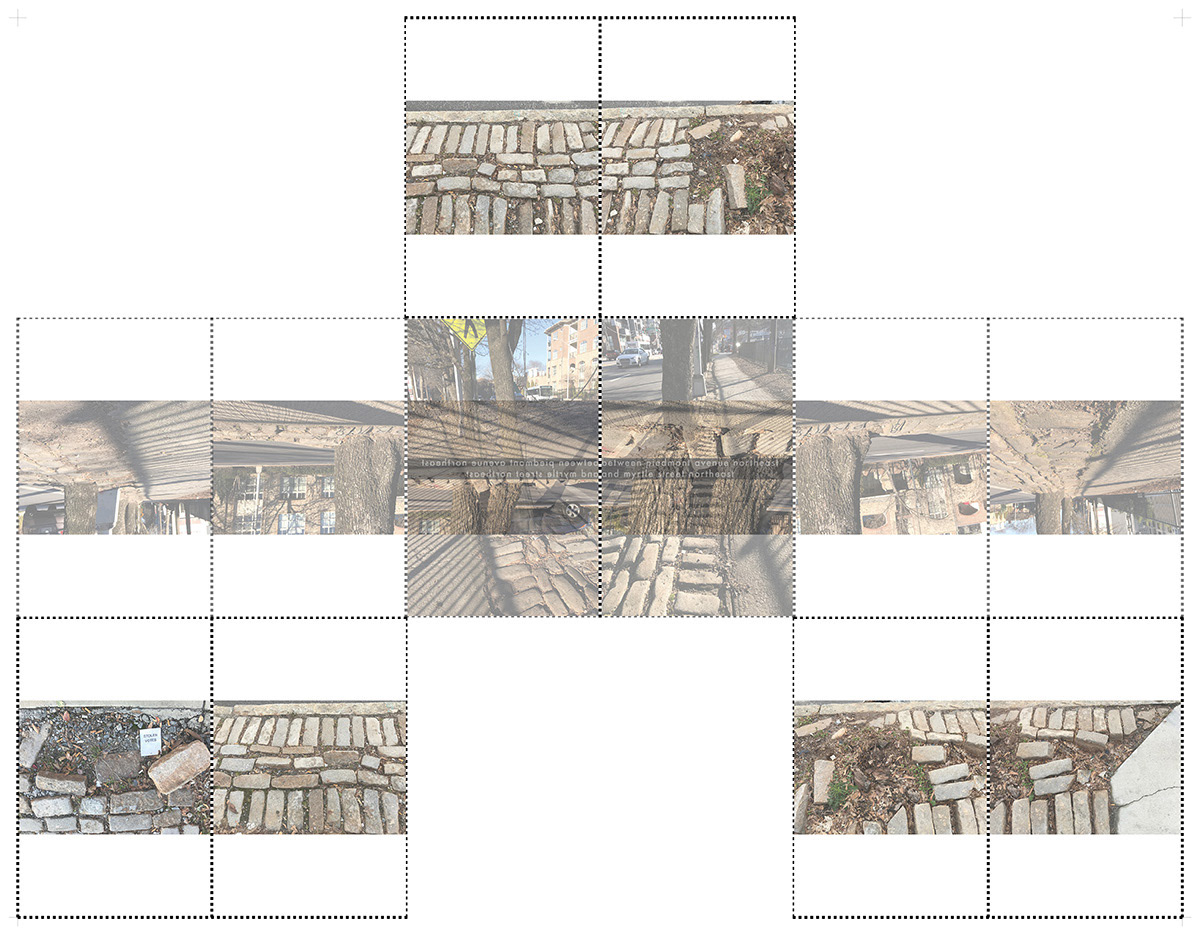
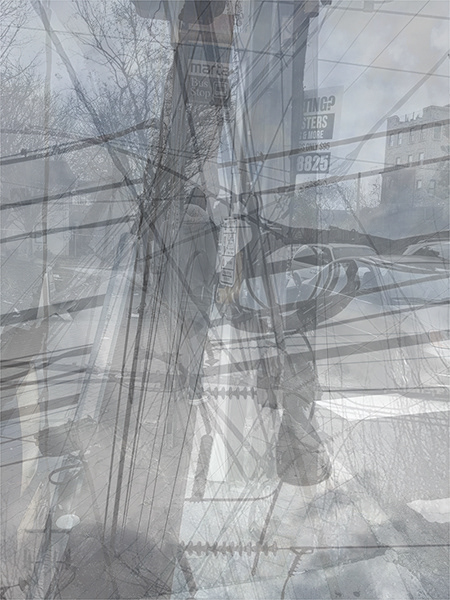
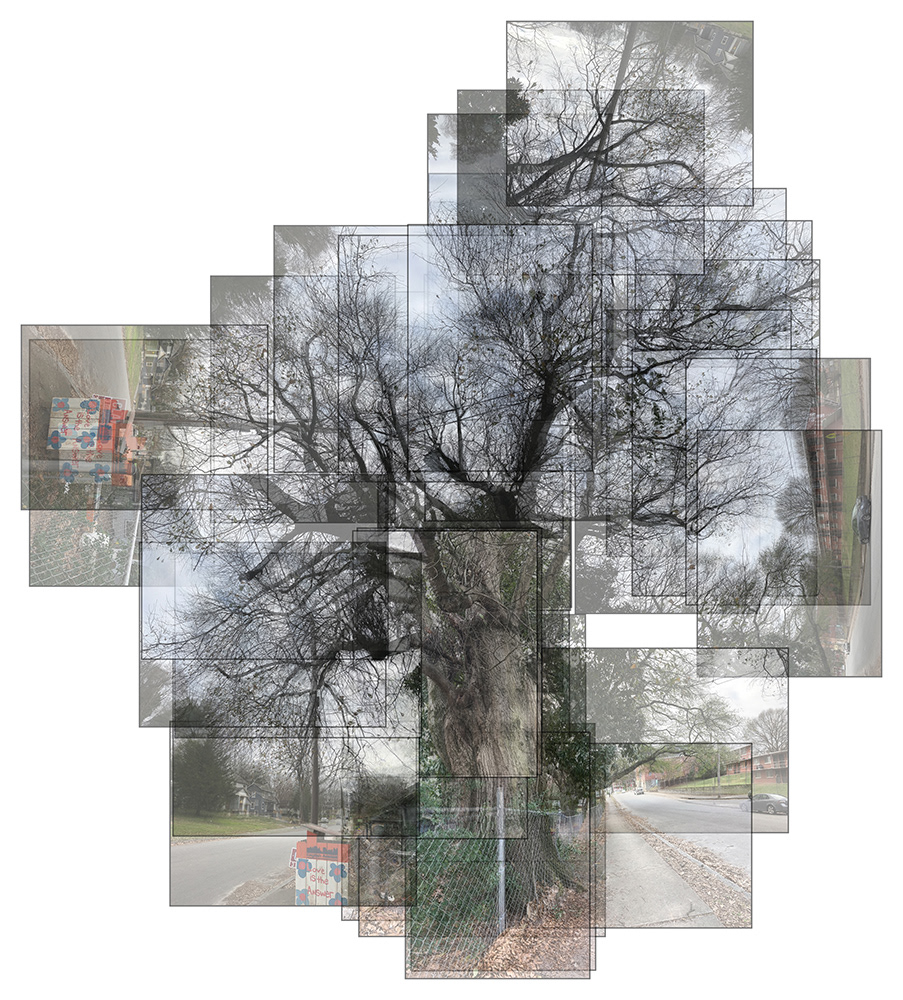
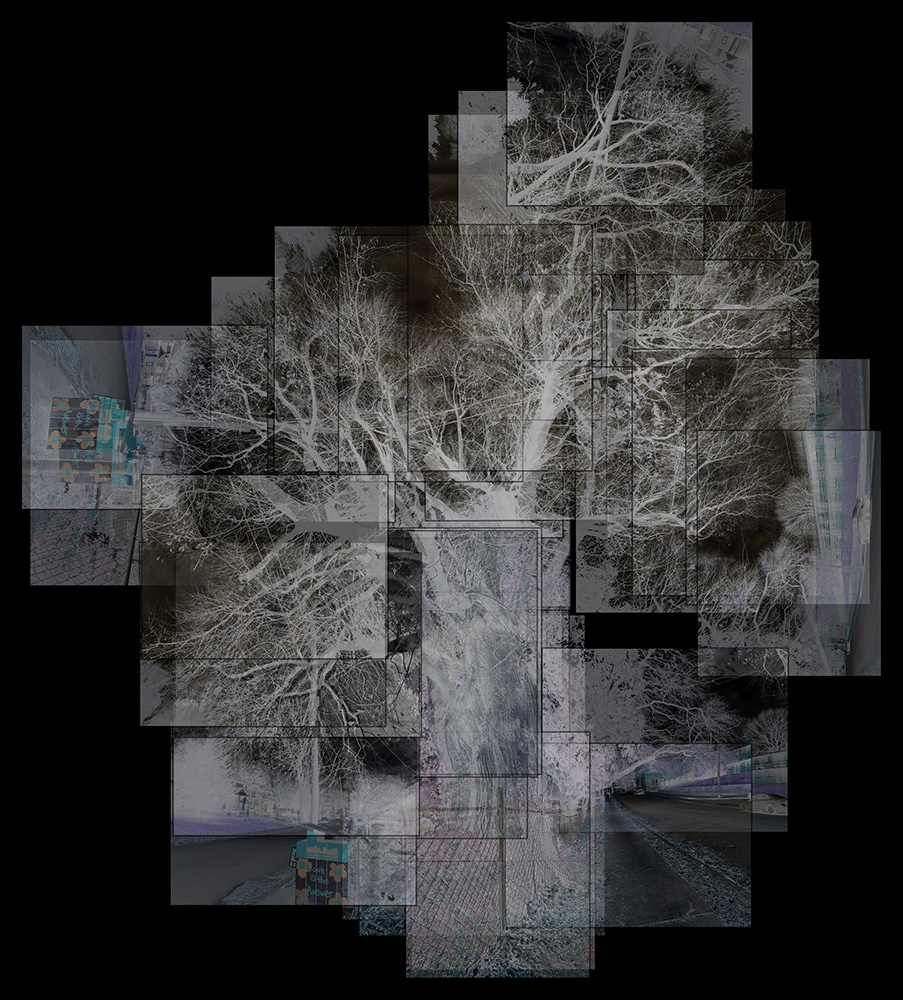
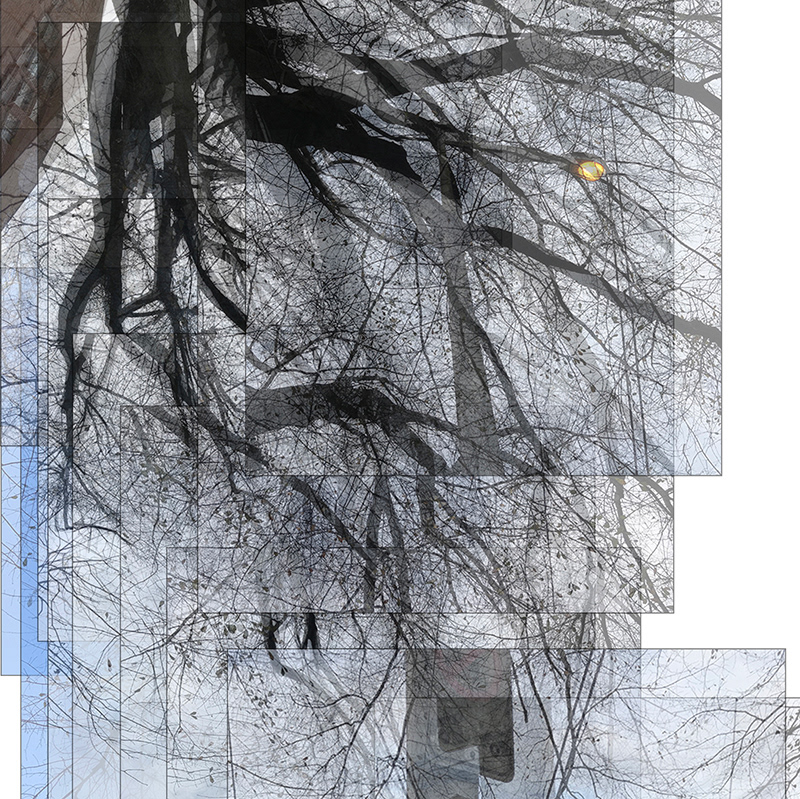
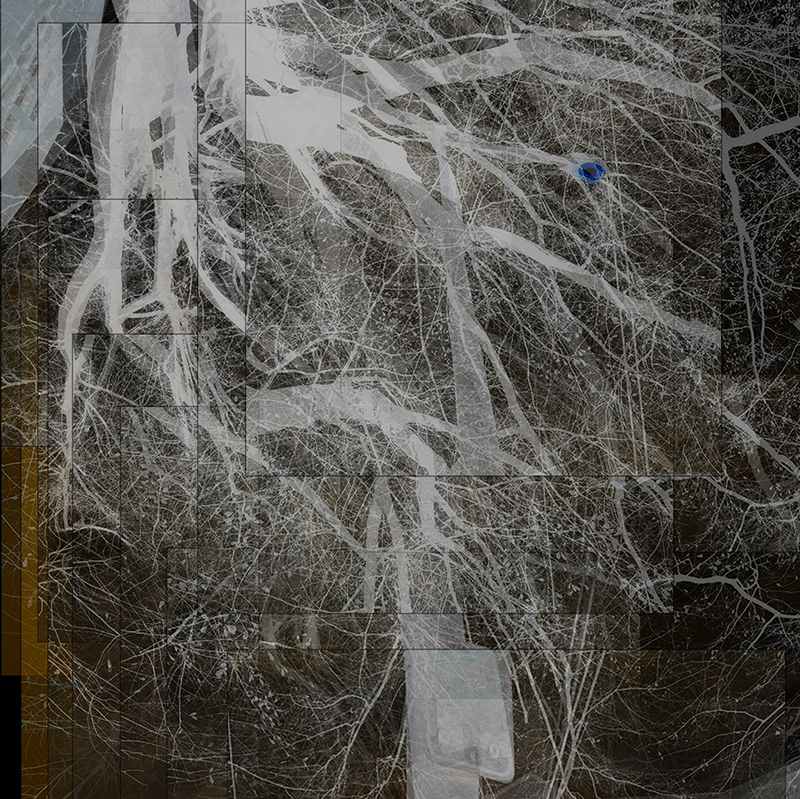
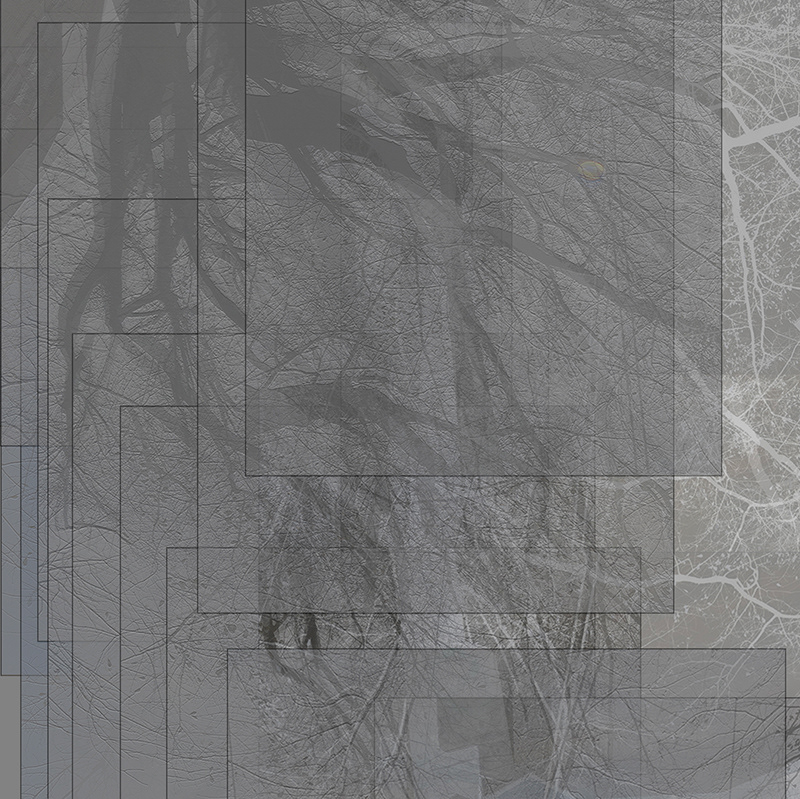
Composite digital photo-collages of street trees, people, and the communication and power lines surrounding and intersecting them along North Avenue. You have to look for the people—The larger trees and utility lines set the scales of these collages. I printed these photos on transparent acetate for the assemblages shown above and below. Click on images for detailed descriptions. Photographed in Atlanta.
Digital photo-collages. I started taking photos of North Avenue, and trees and people on it, soon after beginning this project to map different ways that the street itself is "smart," and different ways of knowing it that are also smart. I began my month-long series of photos on familiar ground: the middle. I've lived and worked for years, on and off, near the avenue's midsection, mostly driving it between other destinations. I started at this old but radically redeveloped turf, then methodically visited and revisited two to three-block segments from the avenue's west end to its east end, at different times of day and evening. I walked back and forth along the gridded blocks, taking photos from different angles and distances. Afterward, I pieced together my digital "smart" phone photos in a collage style inspired by artist David Hockney. Through collage, I wish to represent the different and changing perspectives that you get of the avenue, and the large old oak trees inhabiting it, as you walk.
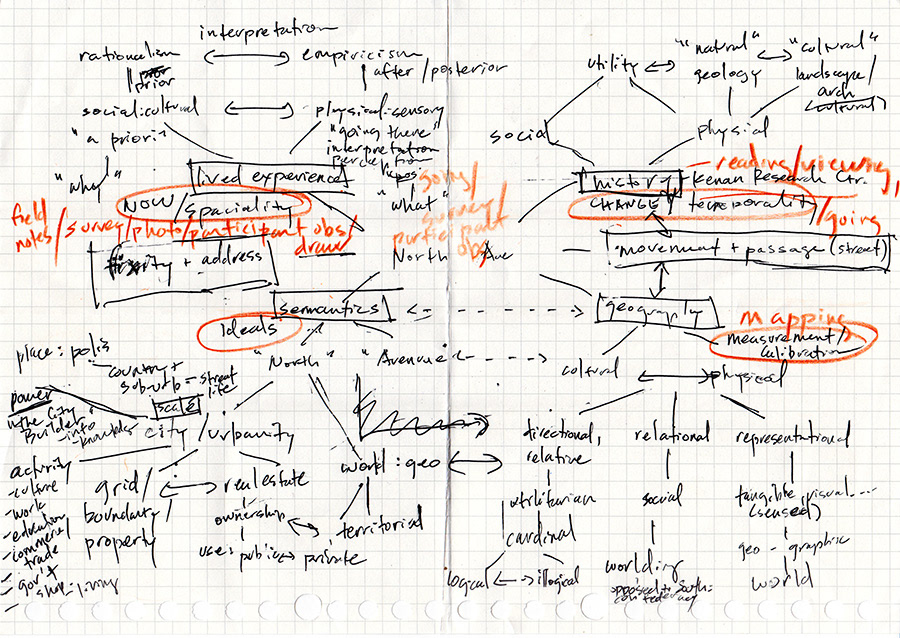
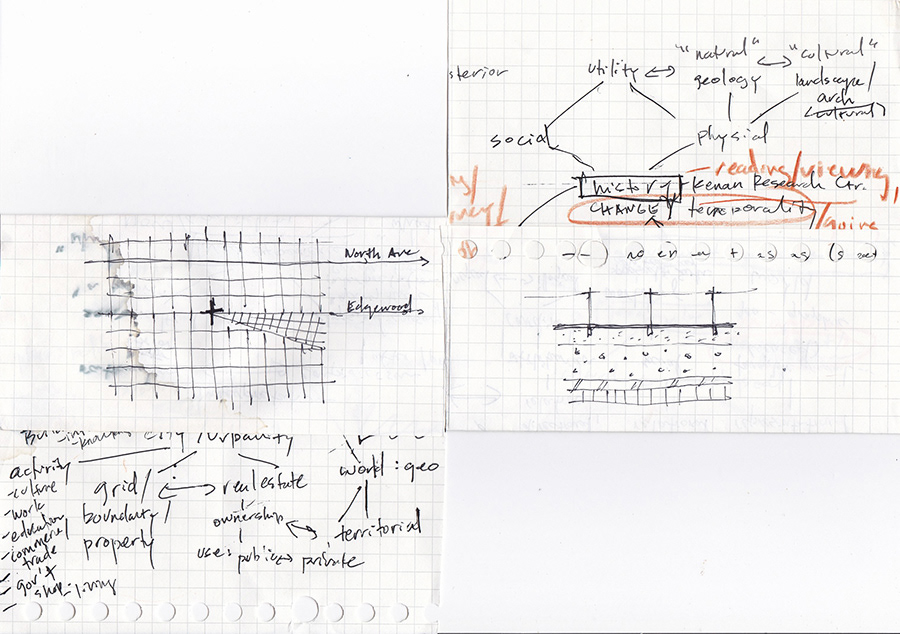
Early solo-brainstorming diagram, following a group brain-storming session Nassim led in seminar.
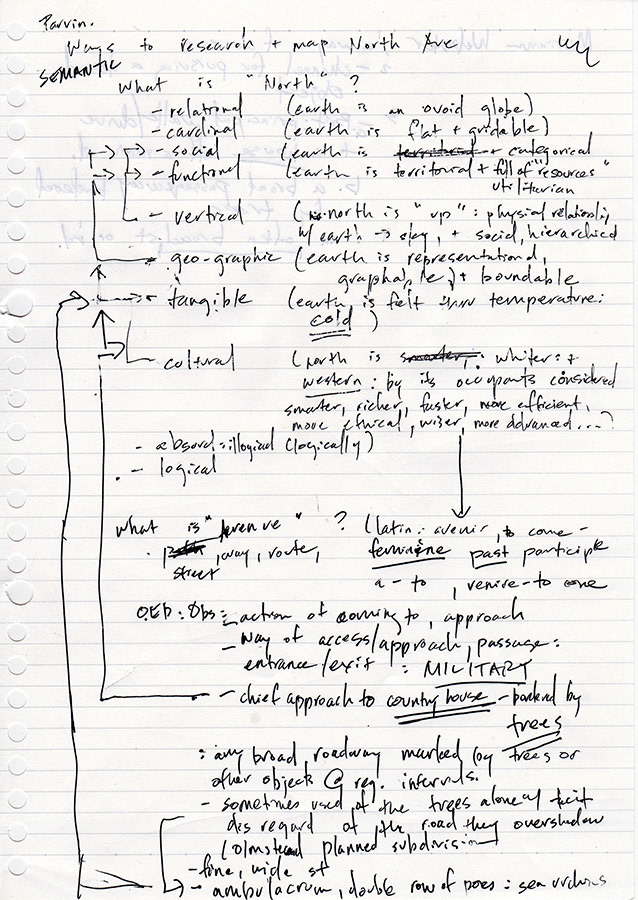
Early notes meanings of the words "north" and "avenue."
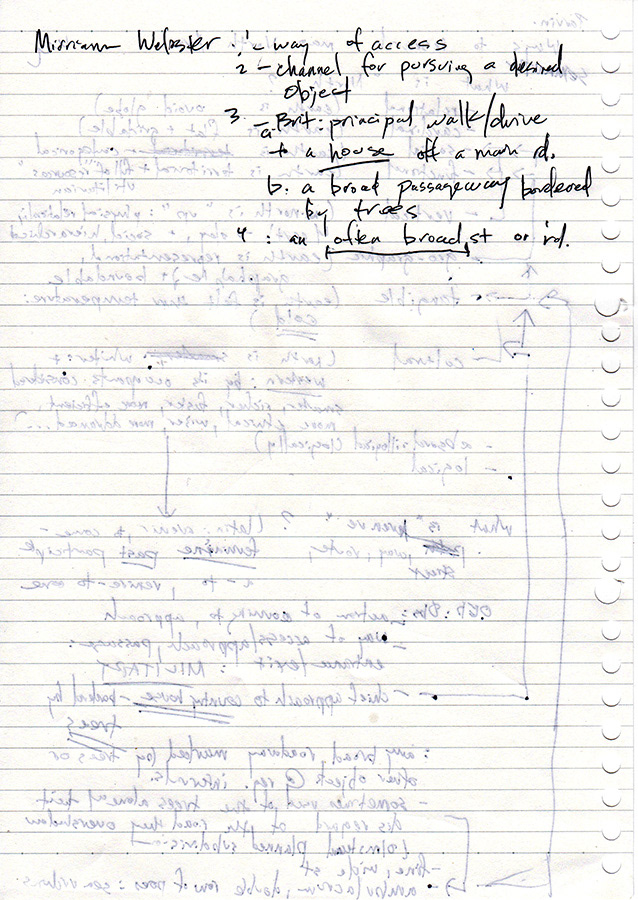
Flip side of notes on definitions of "avenue."
Folding map study juxtaposing brianstormed ideas and smaller, notational sketches of North Avenue. The gridded map "plan" view on left abstracts historic maps of Atlanta that I was finding online. The sketch to the right diagrams a "section" view of communication and power lines along a prototypical city street, imagining a cross-section "cut" through the strata of above and below ground space as vertical layers in a slice of earthen birthday cake. STS philosopher Donna Haraway characterizes the reductive view of plans and sections like these as "a conquering gaze from nowhere," conjured through a "god trick of seeing everything from nowhere" (1988, 581).
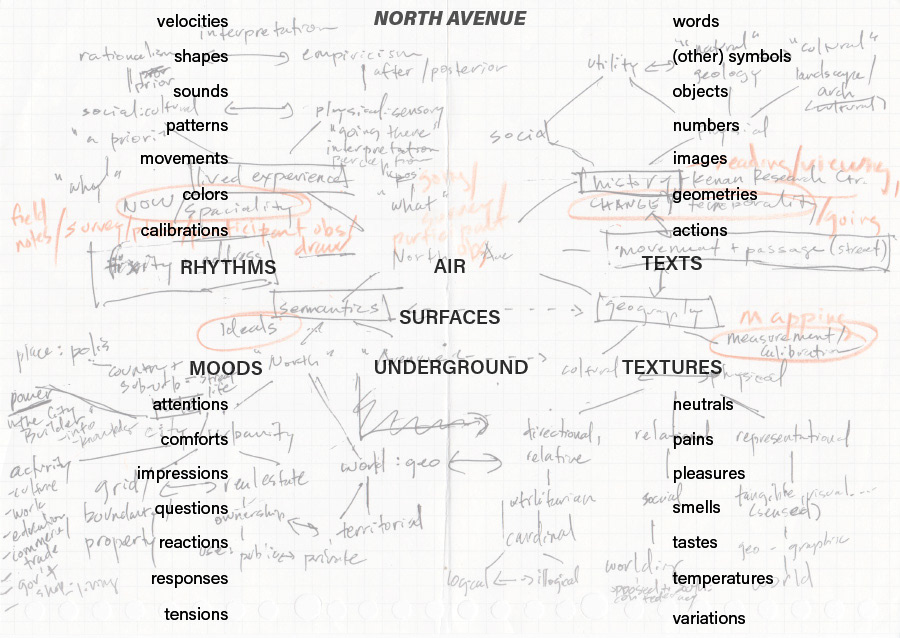
Digital word diagram of remembered and abstracted street conditions overlays a digital photo of my brainstorming diagram.
Early project ideas, diagrams, and notes. Hand and digital drawings and notes digitally photographed in Atlanta. Click on images for details and sources.
Different perspectives. I was looking to the trees for clues to the assigned design problem of figuring out how to map the avenue in relation to this value of smartness. Since a childhood lived with trees in rural Georgia, I've looked to them for answers. Full of life and activity and different responses to different conditions, trees always seem to know more. I'd been researching their underground communications for my MS project in Digital Media. I also brought to this project an interest in affect as a way of perceiving consciousness. And since the project's first week, I'd researched the avenue's history while considering different meanings of "north" and "avenue." Coralling these different perspectives, I added three ancillary questions to my initial inquiry into the avenue's boundaries. I was already finding and imagining potential responses:
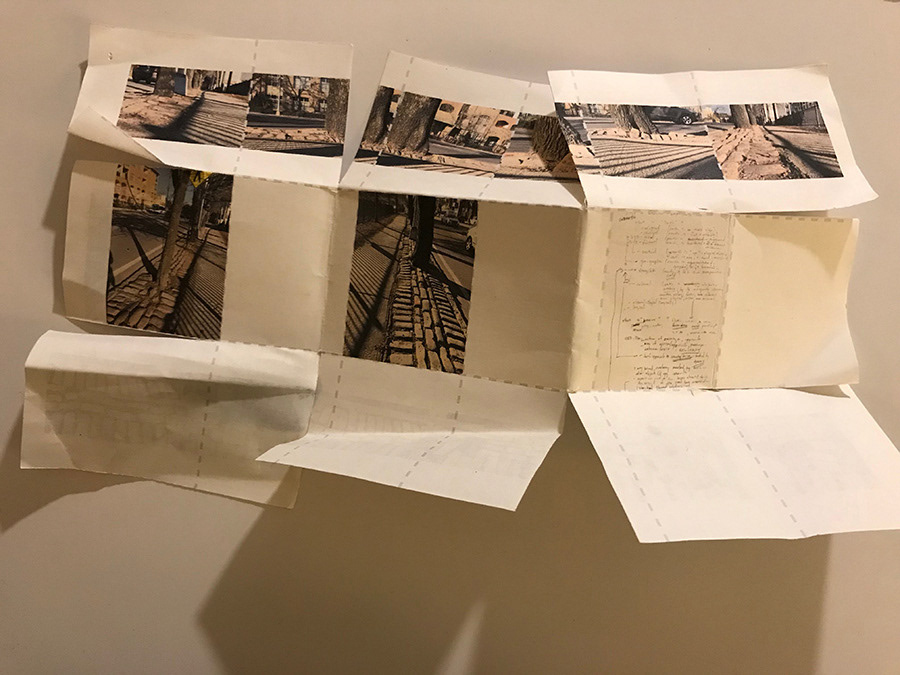
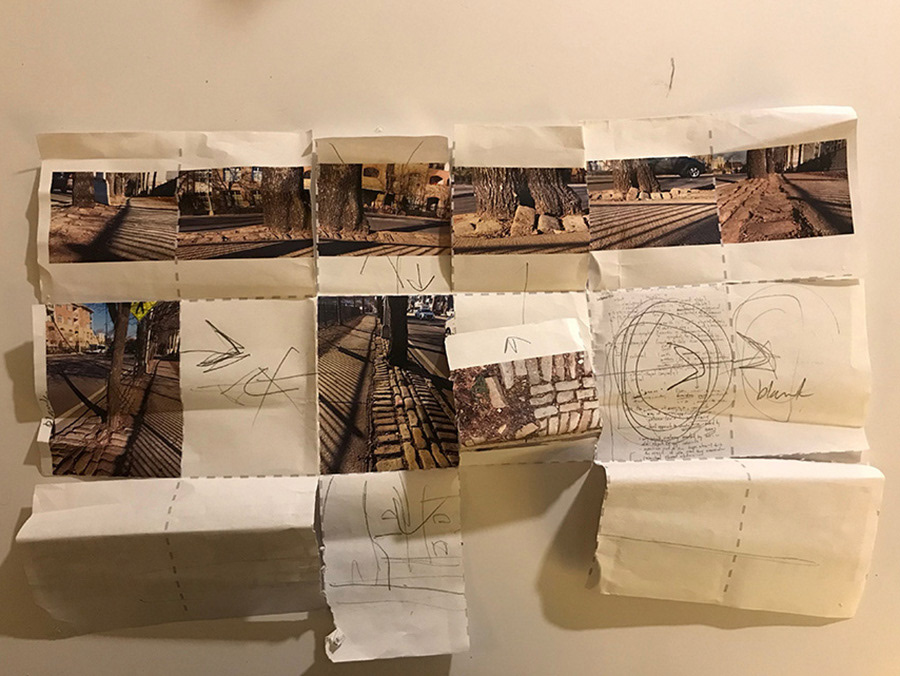
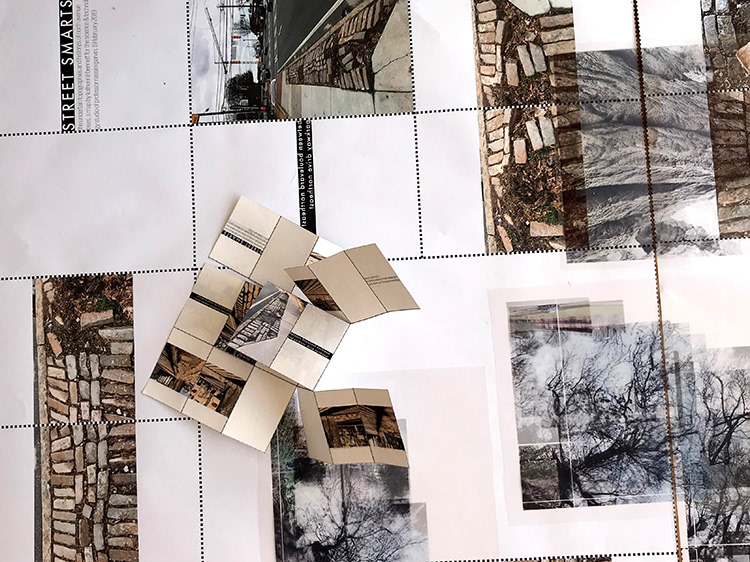
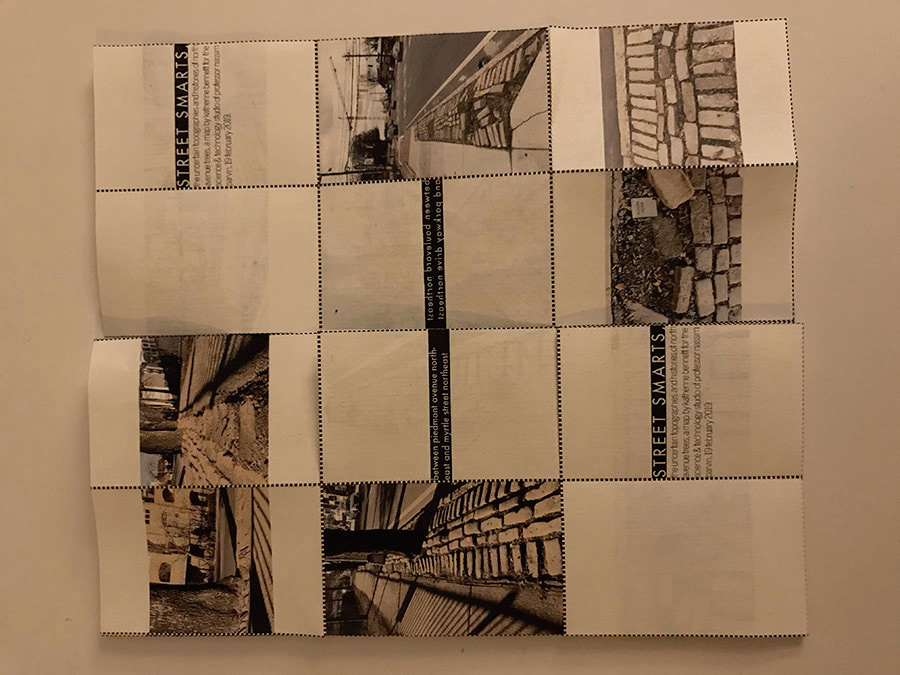
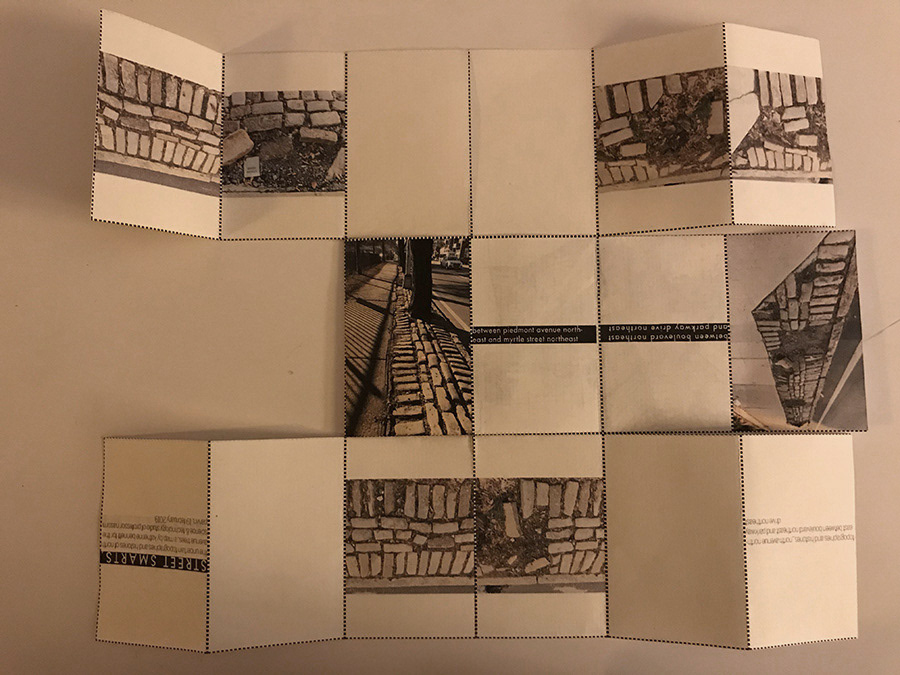
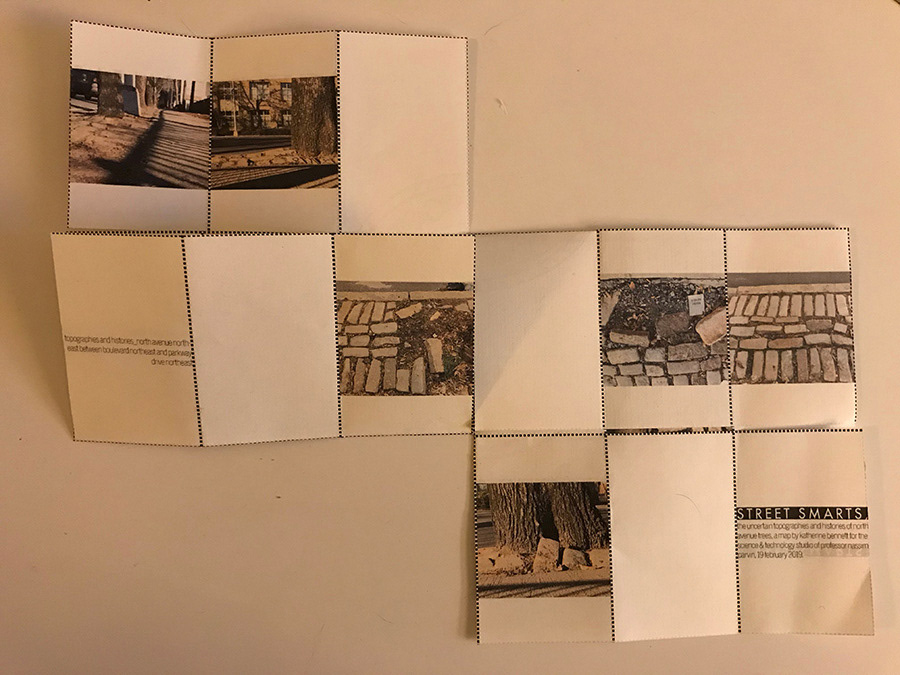
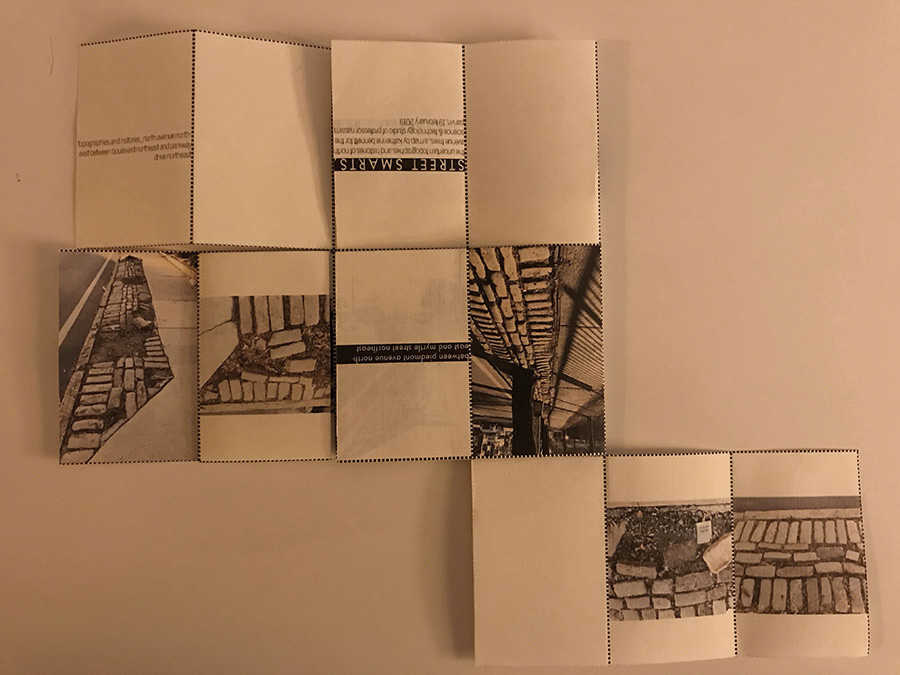
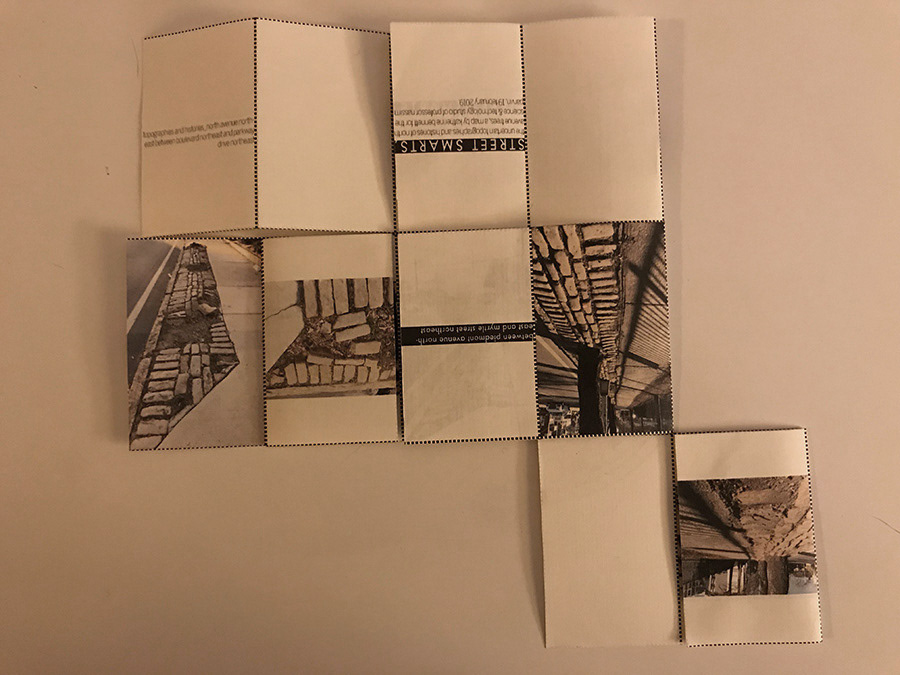
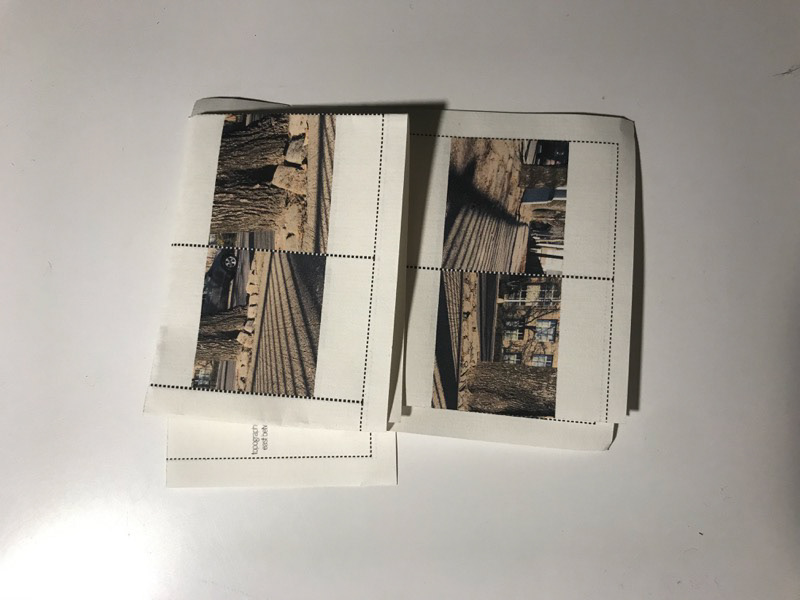
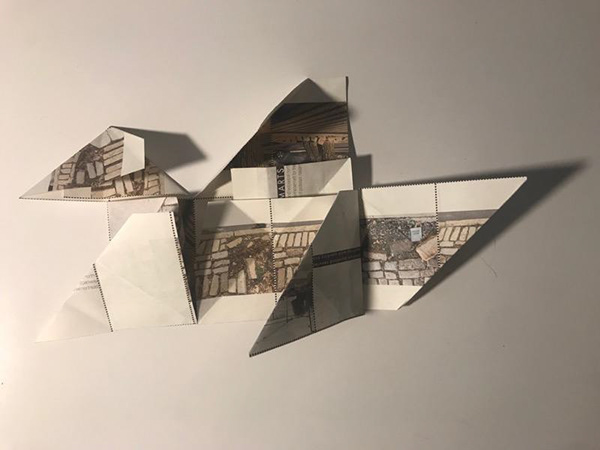
Second and third iterations of folding maps printed on 8.5" x 11" and 11" x 17" paper, which was harder to use. Cutting and folding the maps along the dashed grid lines enables juxtaposition of different images, upright and upside down. Produced digitally and by hand in Atlanta.
Question & response 1. Could I map the surface conditions of trees while reflecting their subsurface movements to intelligently warp the avenue? Trees change street pavements to acquire more oxygen, water, and stabilizing ground-space. To map these changes, I photographed the cracked and warped pavement surfaces that my smart phone and I can record and see, and that my feet can feel. For contrast, I drew subsurface roots by hand. The hand drawings are quirky, more obviously interpretive. I drew them while looking at photos of upended, mature oaks online. Different orientations of my drawings (on moveable clear acetate) and photos (printed on paper) reflect different perspectives of roots and pavements from above, below, and on the ground.
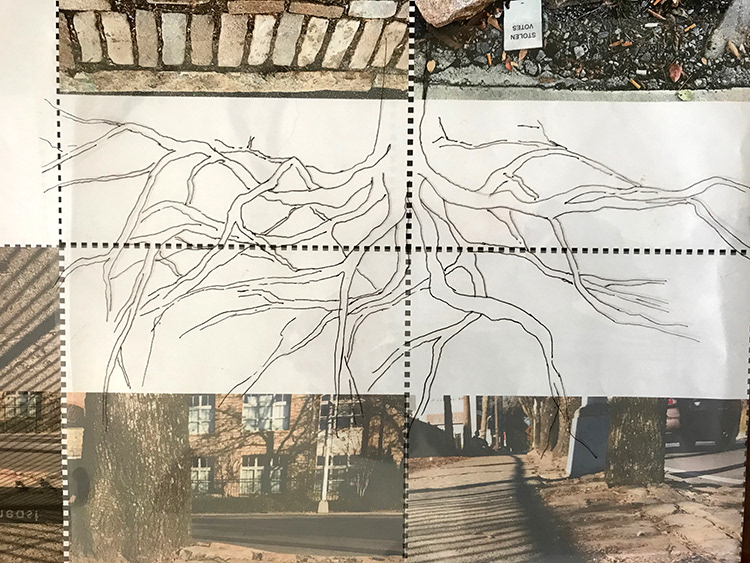
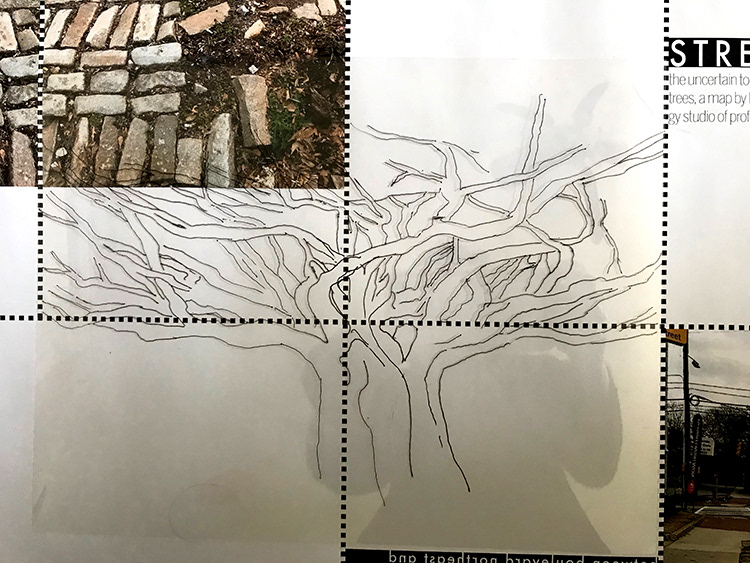
Hand drawings of tree roots on clear acetate, overlaid on the printed map diagrams. My hand drawings are based on digital photos of oak tree roots found online. Map roots drawn in rural Georgia, and photographed in Atlanta with digitally produced map diagrams.
Question & response 2. Could I map what it feels like to walk or otherwise move along North Avenue in different places and conditions? I'm after representations of affect and the feelings it may—or may not—convey. I can't say with certainty that I know or represent how anyone else feels, especially not a tree. But, to the extent that the avenue twists and warps tree bodies and my body (tripping and falling on uneven sidewalks), I can start to empathize. My perspective of North Ave—mostly from a car—also differs from those of people that I saw walking, using wheelchairs, and waiting for buses. Still, through shared experiences of the street, I hope to map the emotive impressions of different perspectives, as I perceive them with my body.
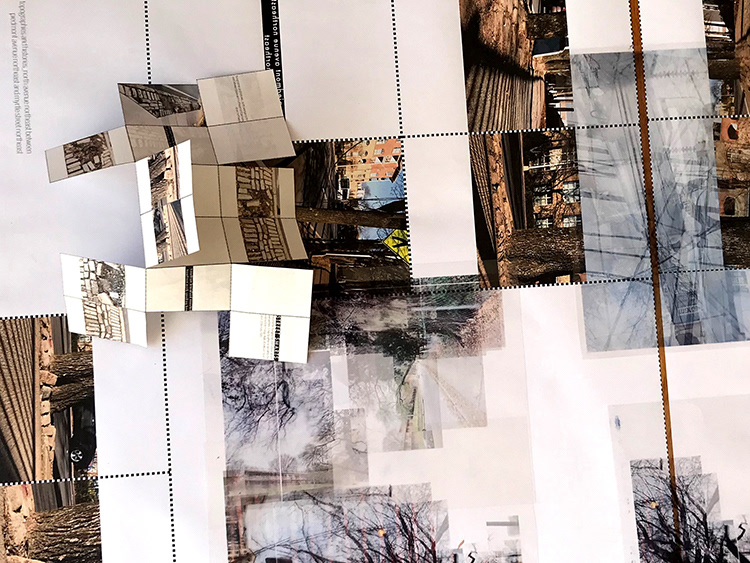
25.5" x 33" map diagrams, 8.5" x 11" folded maps, and 8.5" x 11" photo-collages on acetate overlays produced digitally in Atlanta. Assemblages of folded maps, map diagrams, and acetate overlays photographed in rural Georgia.
Question & response 3. Could I map territorial relationships between the bounded conditions of directional words like "north" and the mobile conditions of an "avenue"? Cardinal directions like "north" connote fixed and bounded territories: How otherwise can "north" mean anything on a globe spinning in space? At the same time that "north" seems to flatten the earth's surface, it implies vertical social hierarchies: Why else do people talk about the "Global South" as less advanced, less educated, and less smart than "The North" (or "West")? "Avenue" also conveys mixed messages: The word derives from Latin for "coming to," and probably even older, "southern" and "eastern" languages. In military use, "avenue" historically meant an opening or closing of fortified territory (Oxford English Dictionary). More domestically, "avenue" signified the main approach to an elite country estate, and now refers to any road bordered by regularly spaced trees.
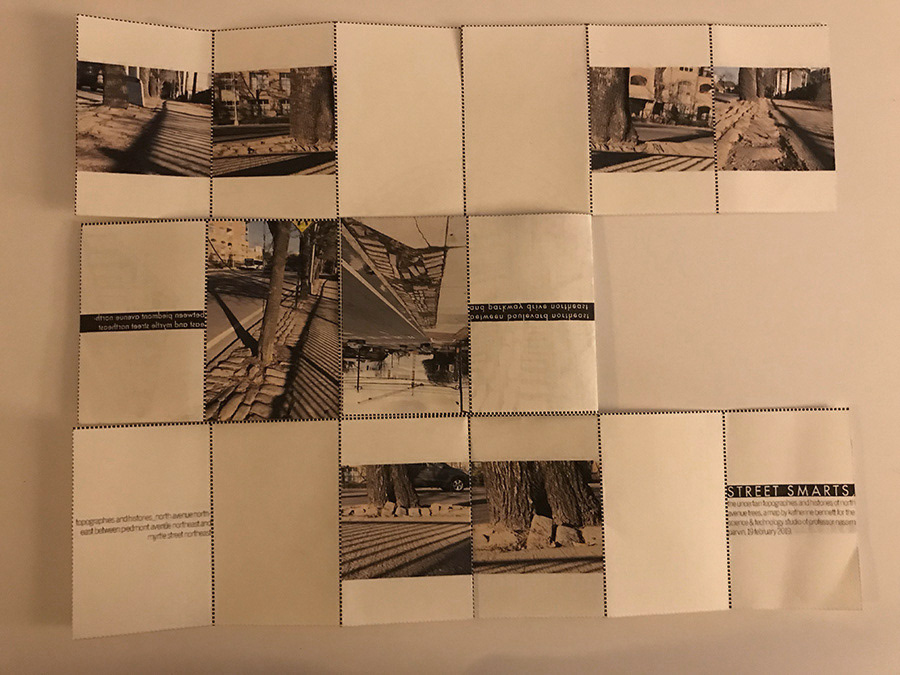
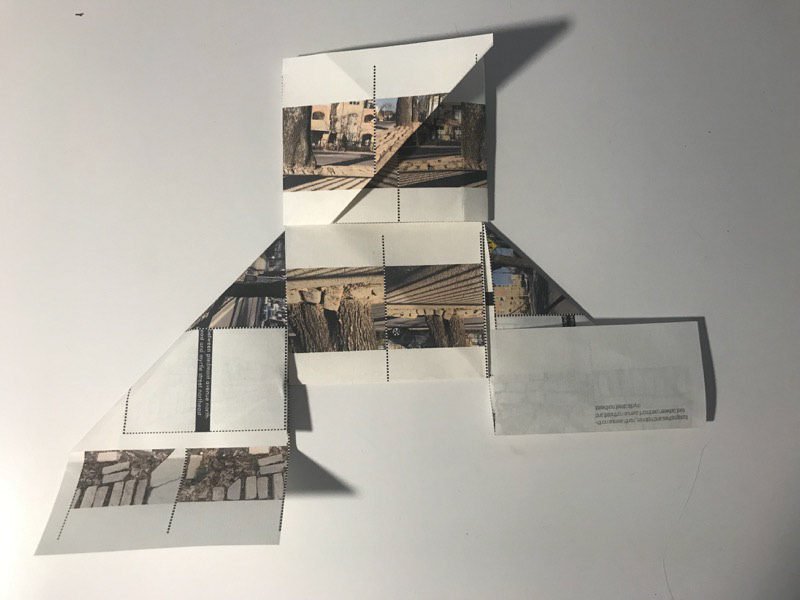
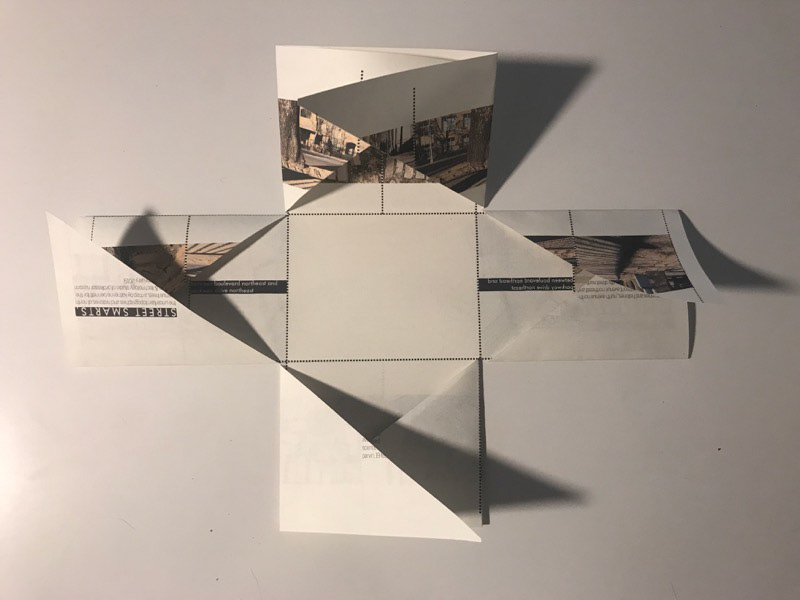
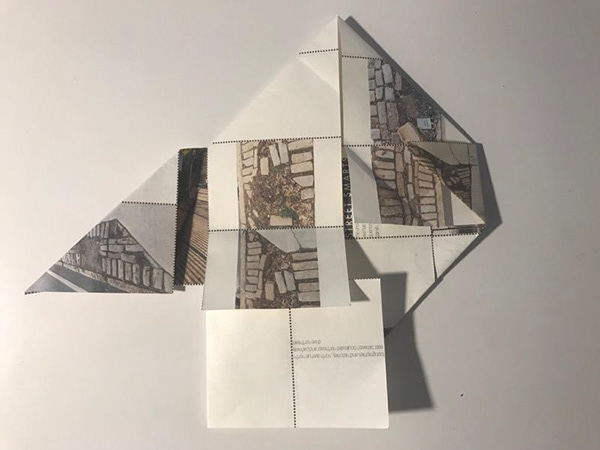
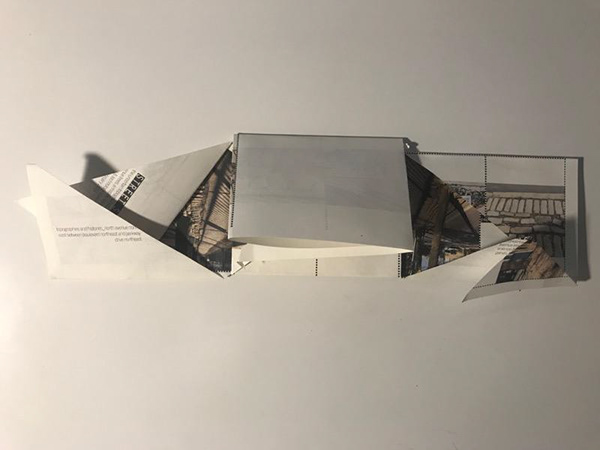
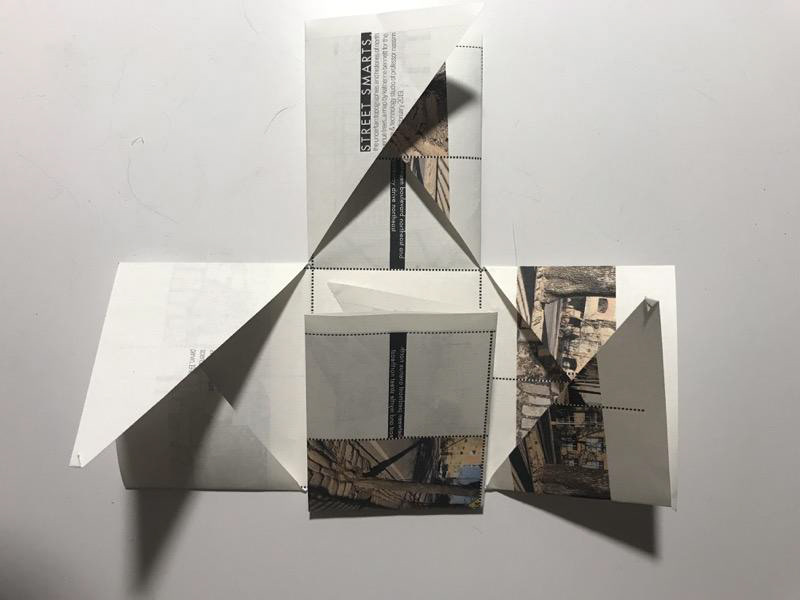
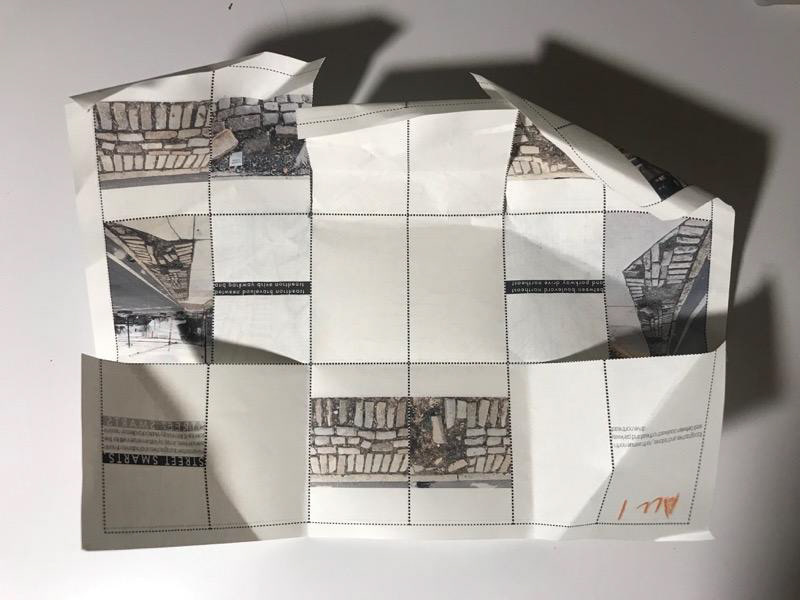
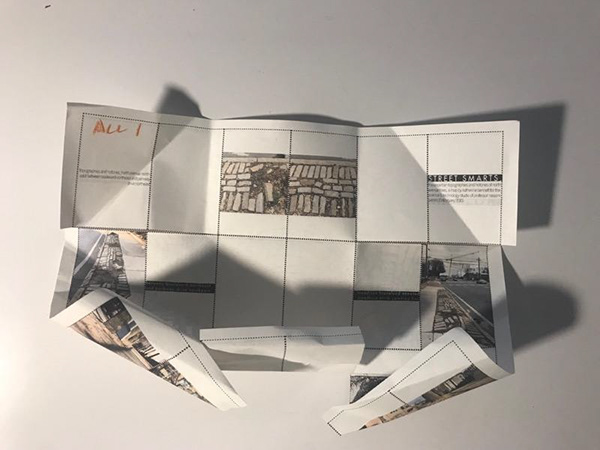
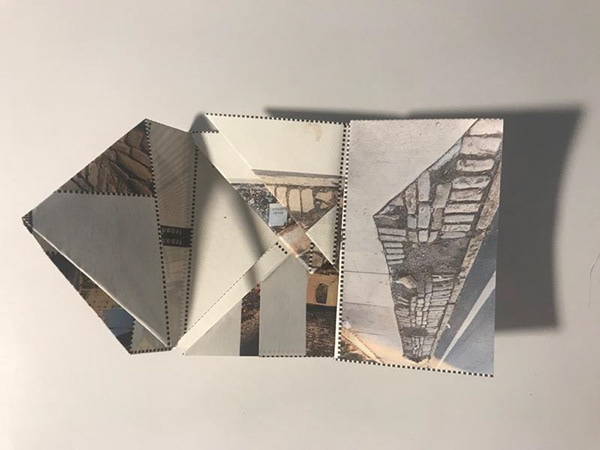
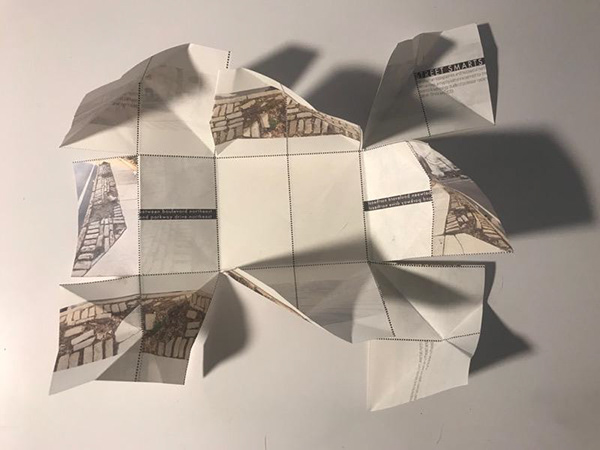
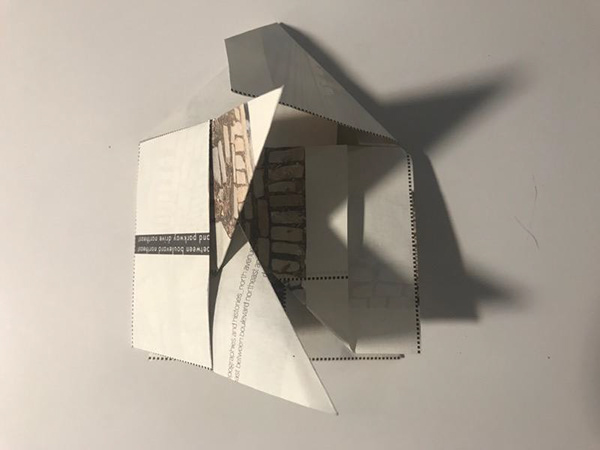
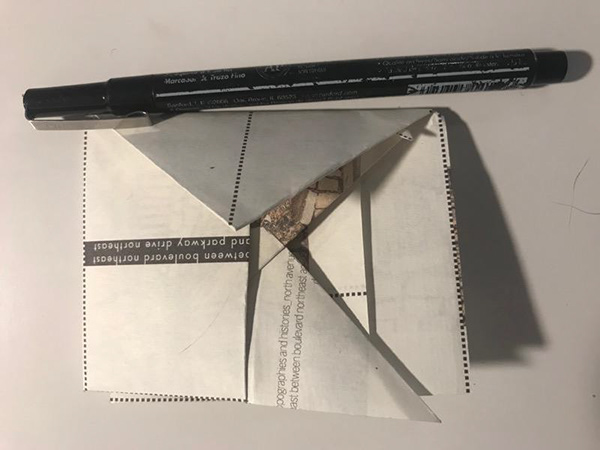
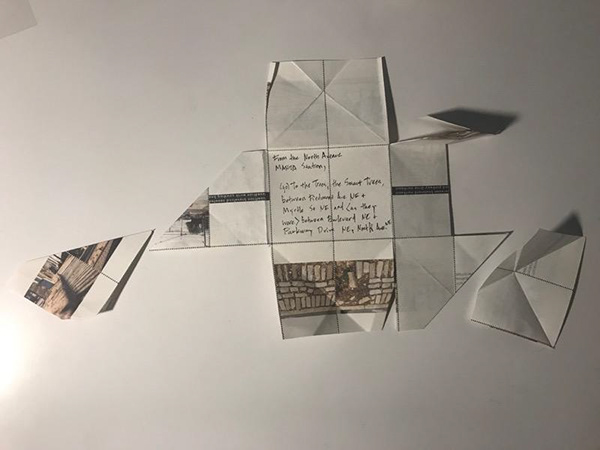
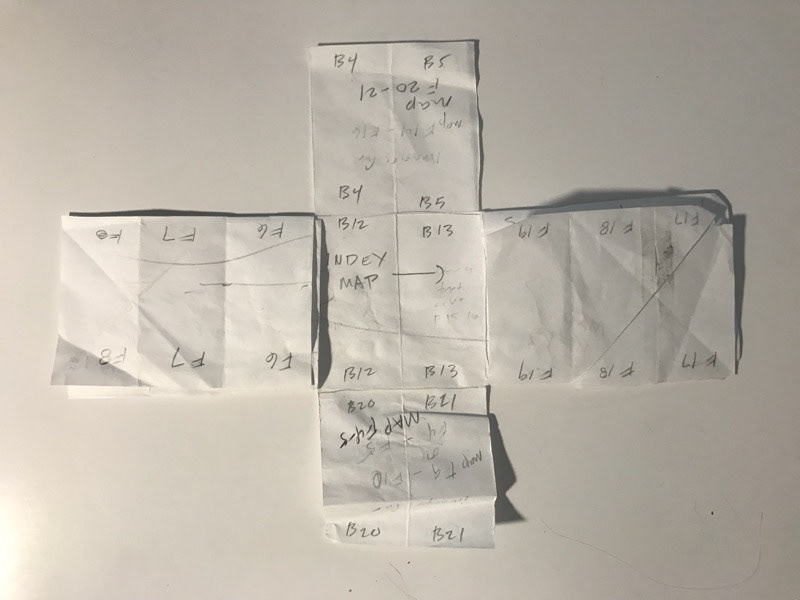
Folding version 1 is cut along the top and bottom center grid lines.
Folding version 1 (see description in preceding image caption.)
Folding version 1 (see description in preceding image caption.)
Folding version 1 (see description in preceding image caption.)
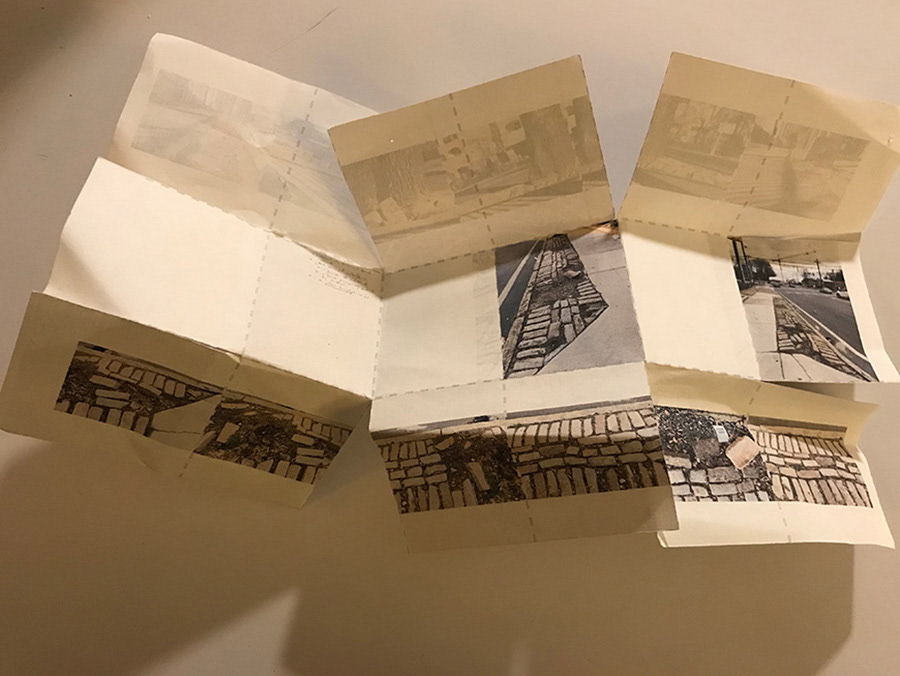
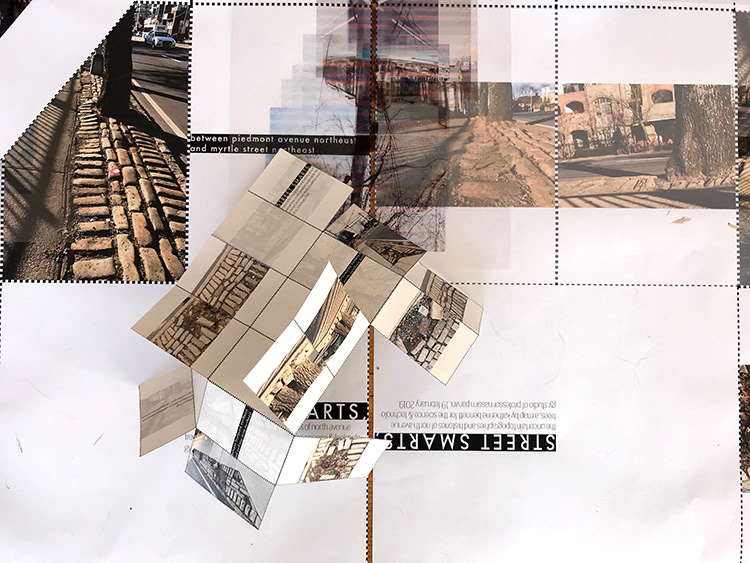
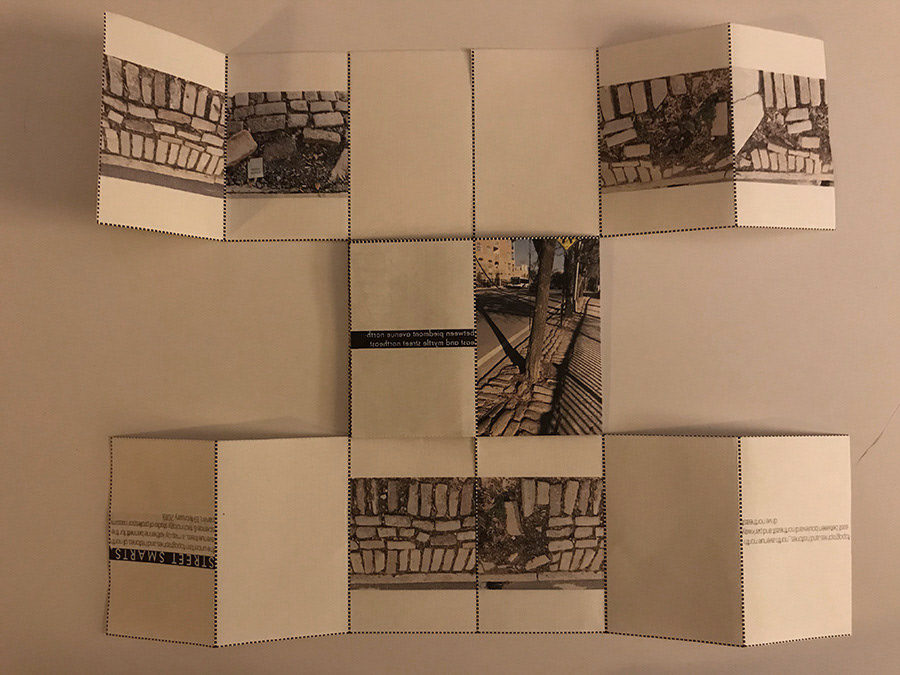
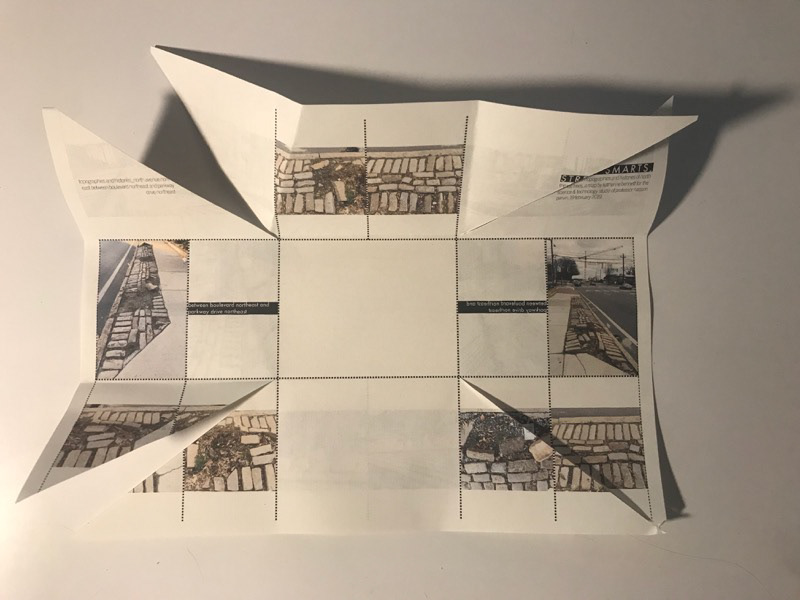
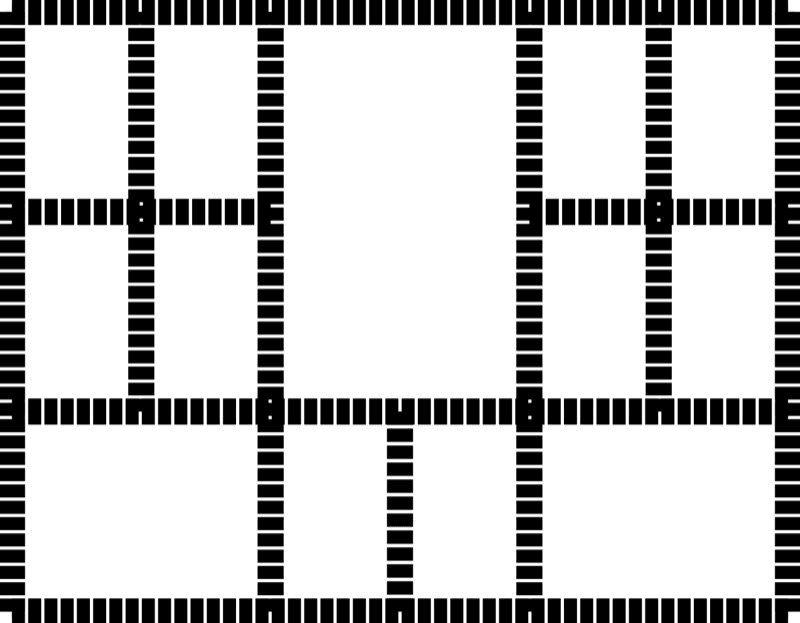
top, Digital map templates for letter-sized folded maps. These templates don't represent the effects of folding the maps, as the larger map diagrams do. below, Letter-sized fold configurations. These photos show a first version of the (more) final folded map, which is cut along the top and bottom center grid lines (as represented in the map diagrams). Produced digitally and by hand in Atlanta.
Question-response 3, continued. I have limited my map photos to the spaces between dashed lines for cutting and folding. The map grid bounds these surface representations, much as street grids bound the movements of trees and people. In contrast, my moveable root drawings weave around and beyond these grid lines as actual roots do underground. People also move around and beyond street grids, jaywalking, cutting across flower beds, and so on. My map diagrams, with their acetate overlays and trimmed paper "roots," belong on the floor, where people (and cats) can walk across them and move them around. (My printed map diagrams have inky foot and paw prints.)
Folding version 1 (see description in preceding image caption.)

Folding version 1 (see description in preceding image caption.)
Folding version 1 (see description in preceding image caption.)
Folding version 1 (see description in preceding image caption.)
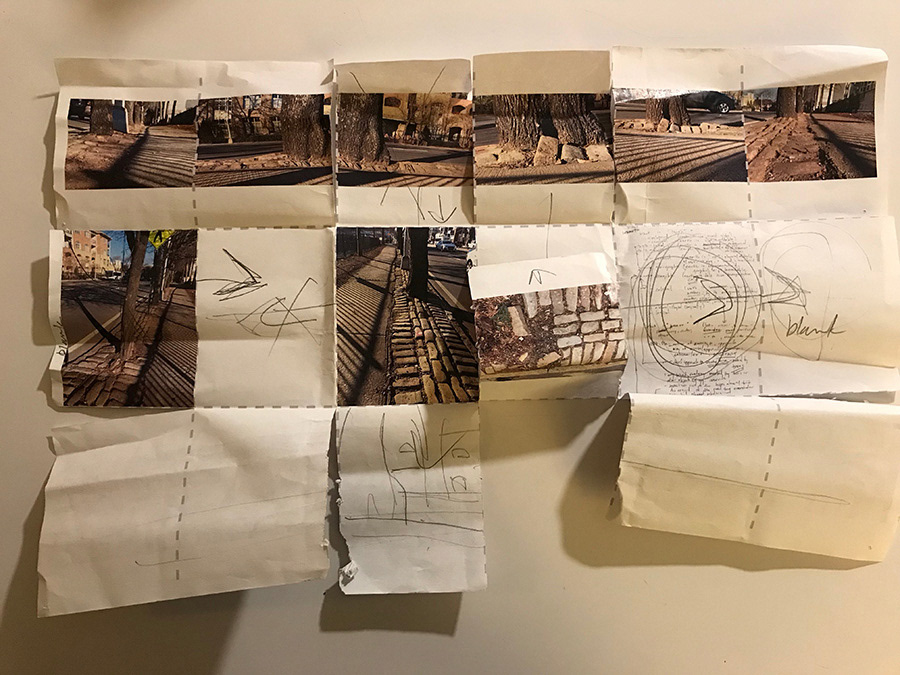
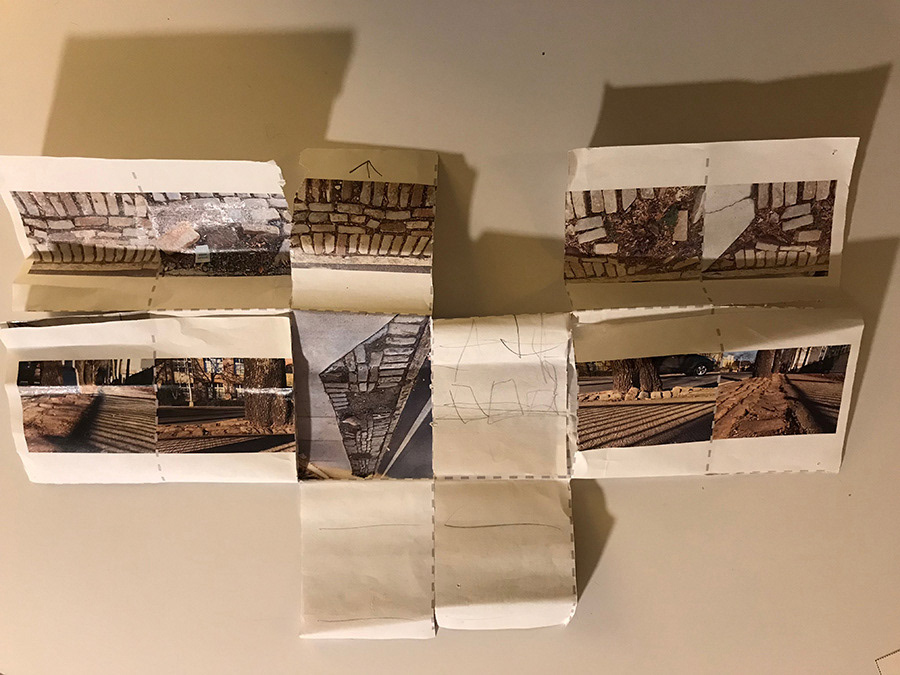
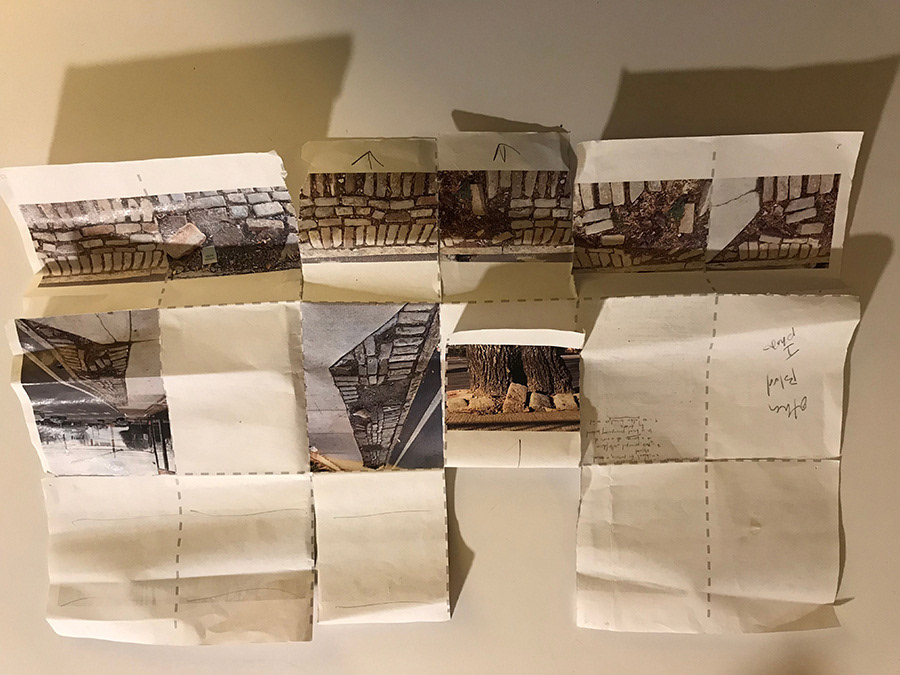
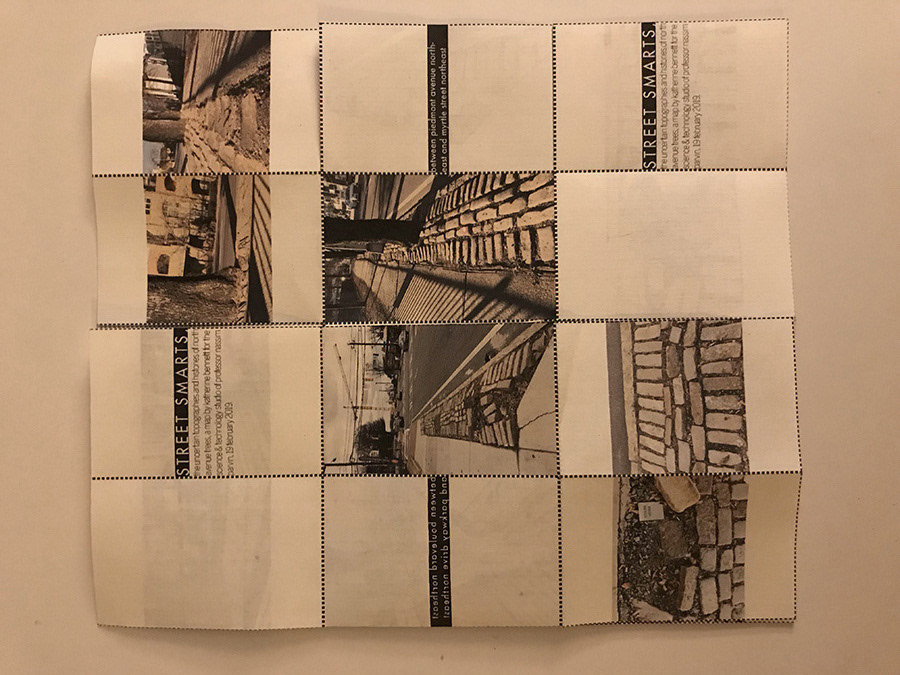
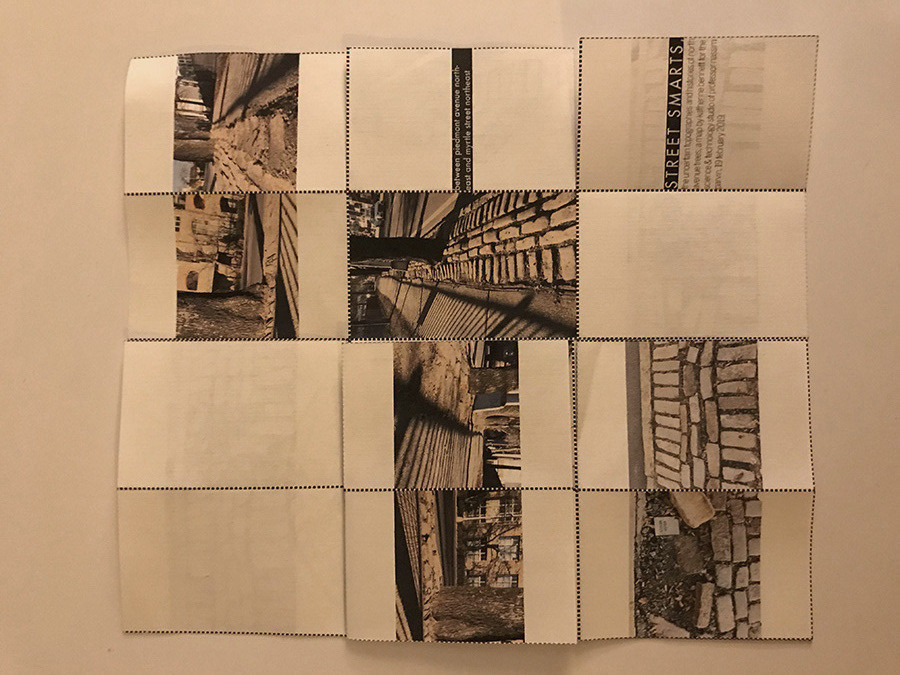
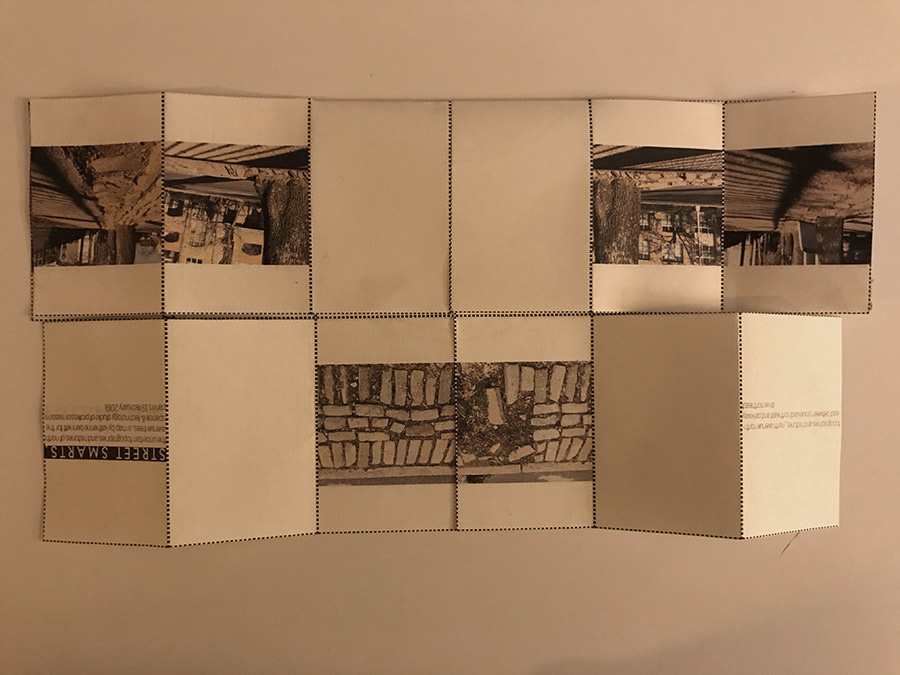
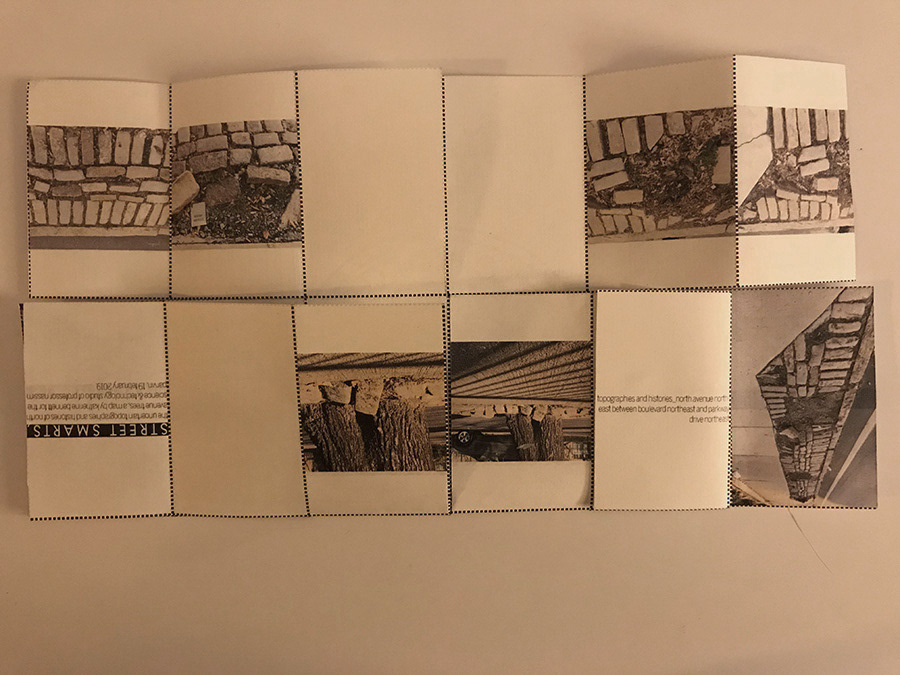
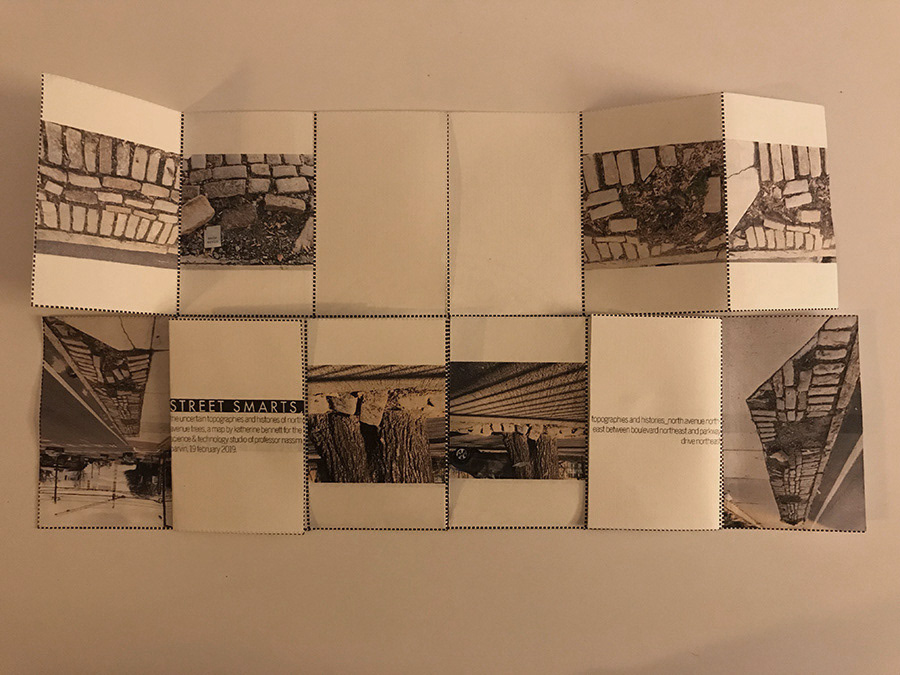
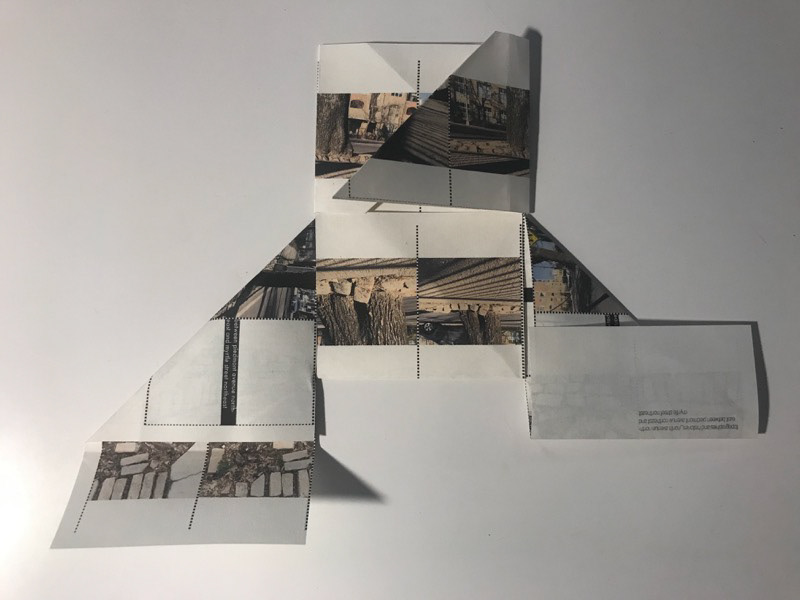
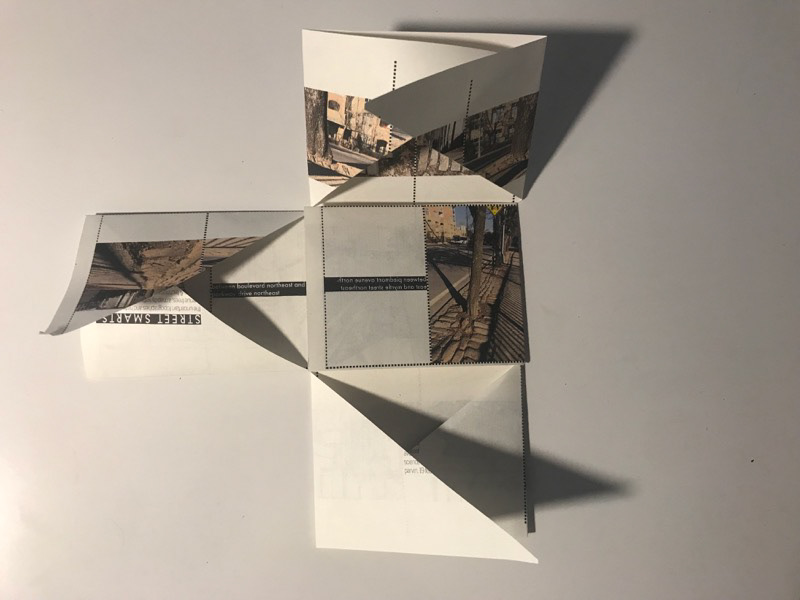
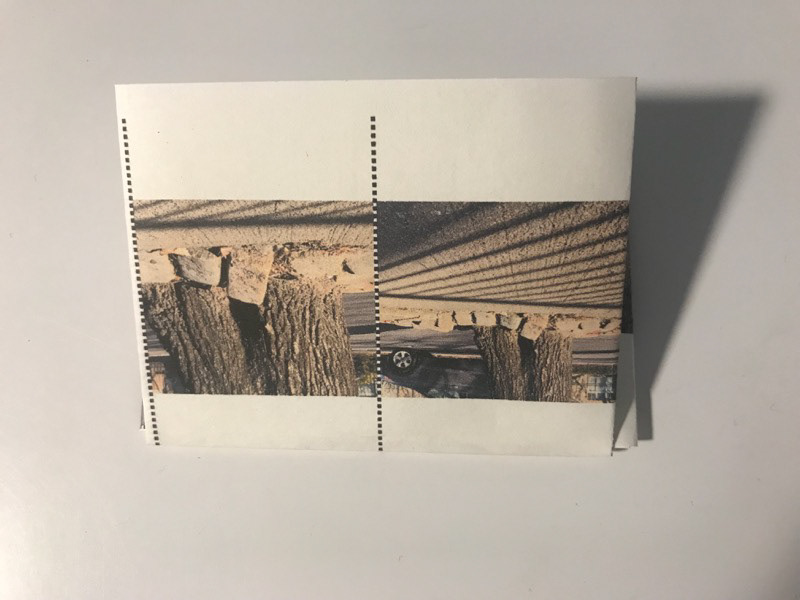
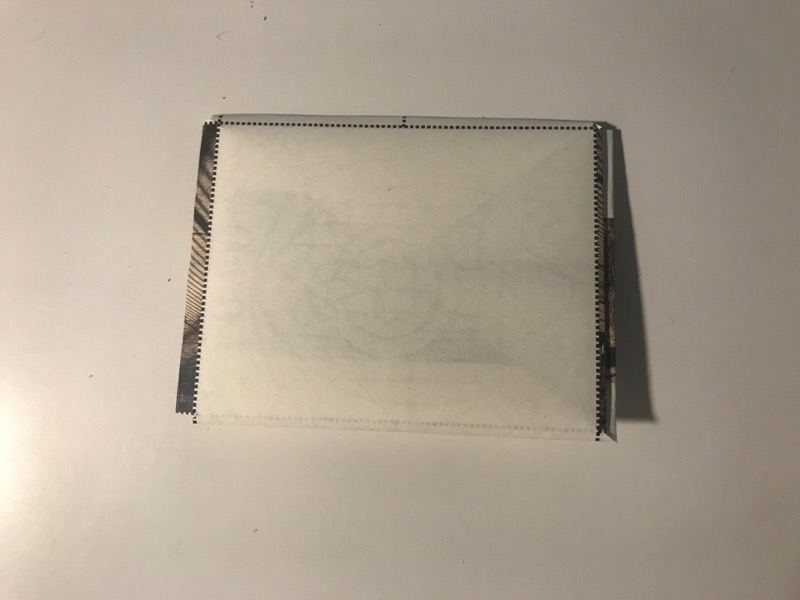
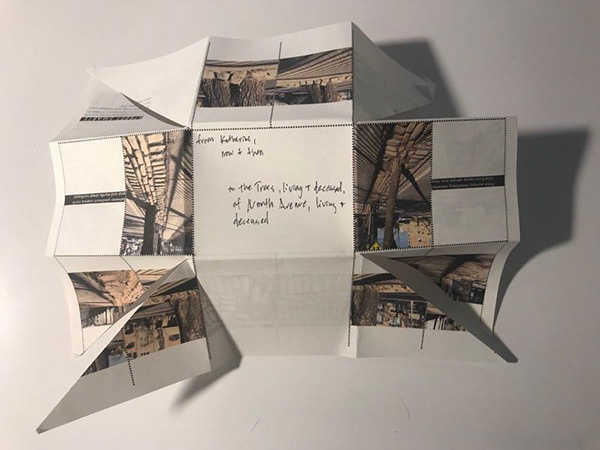
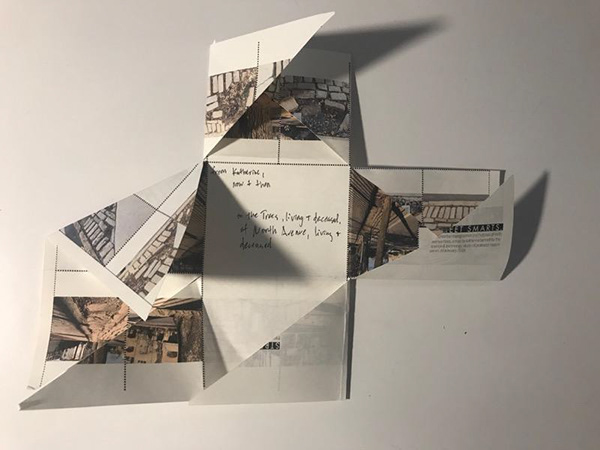
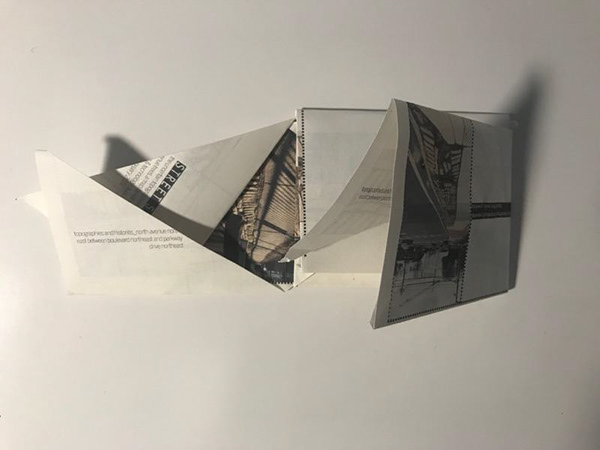
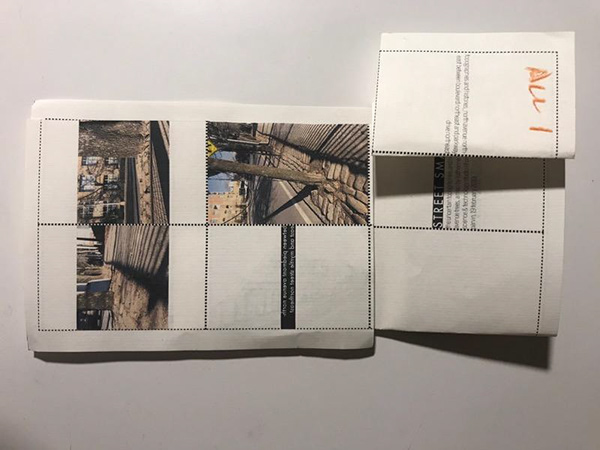
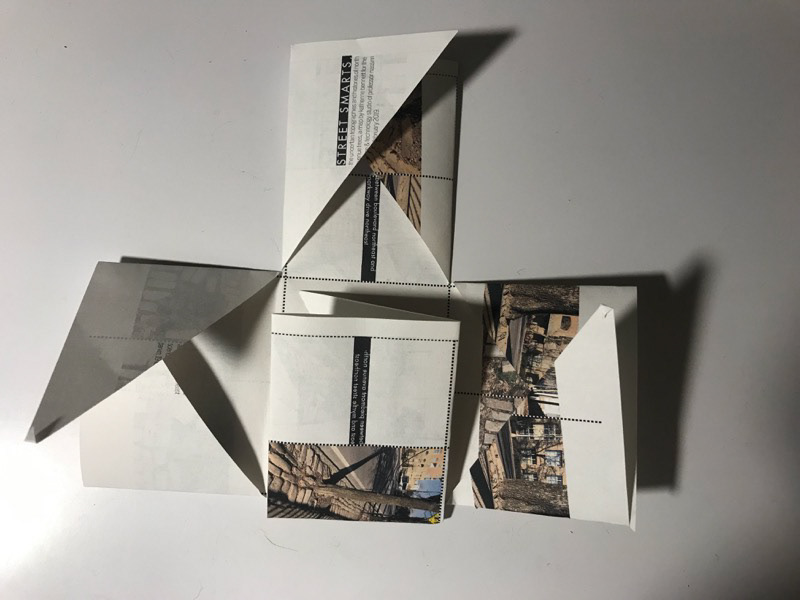
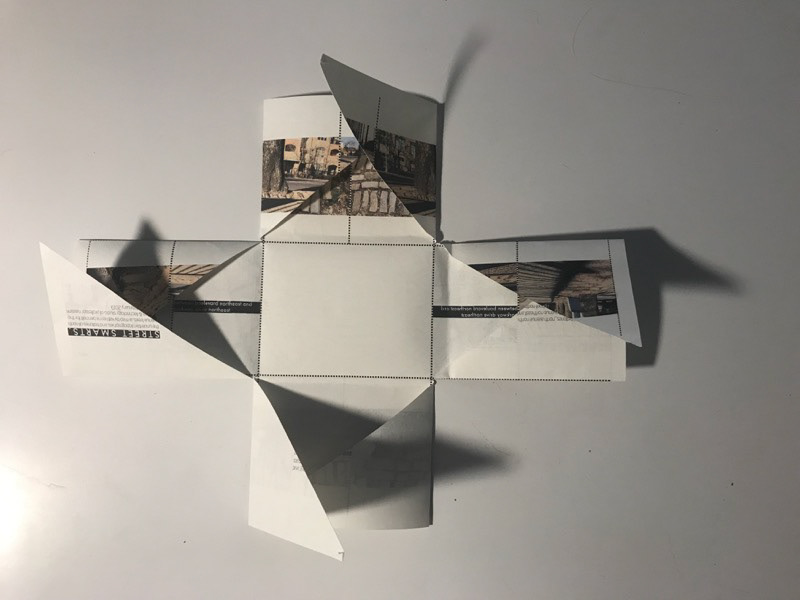
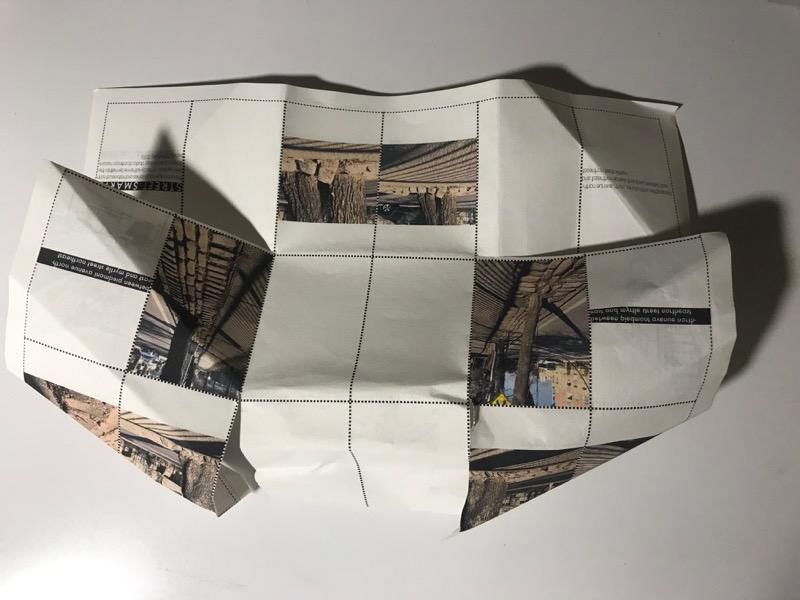
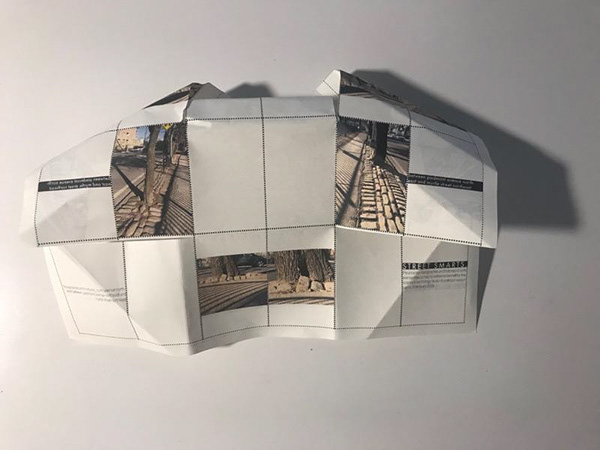
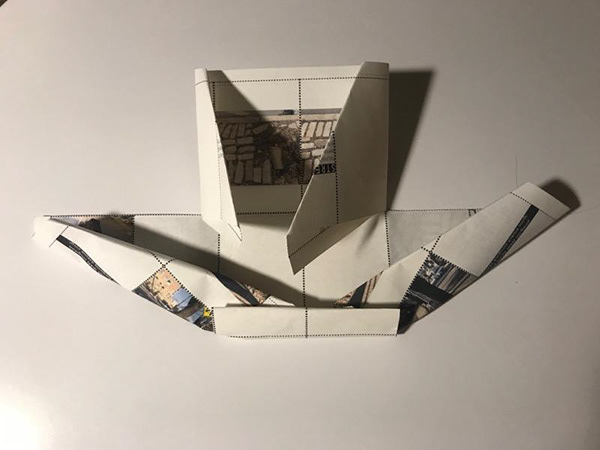
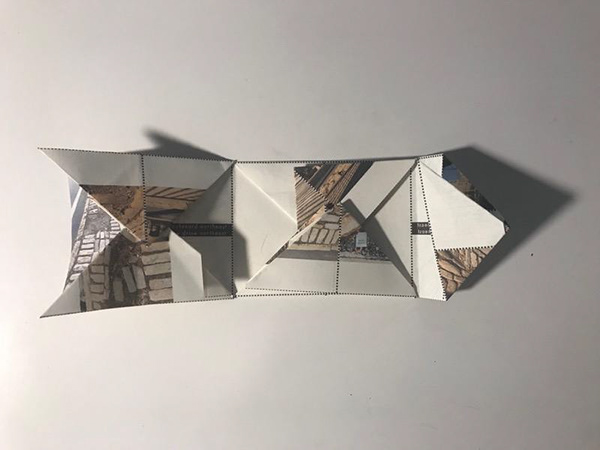
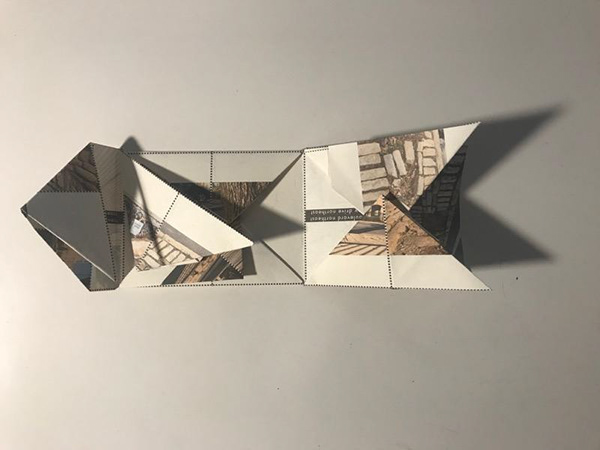
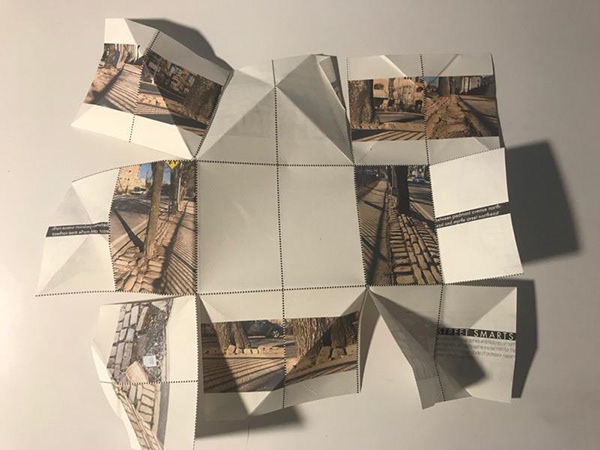
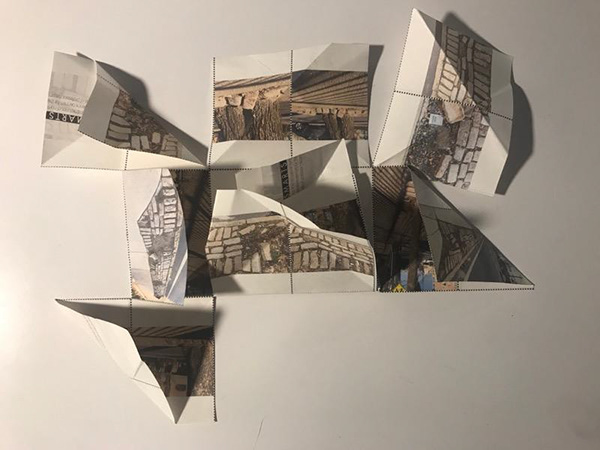
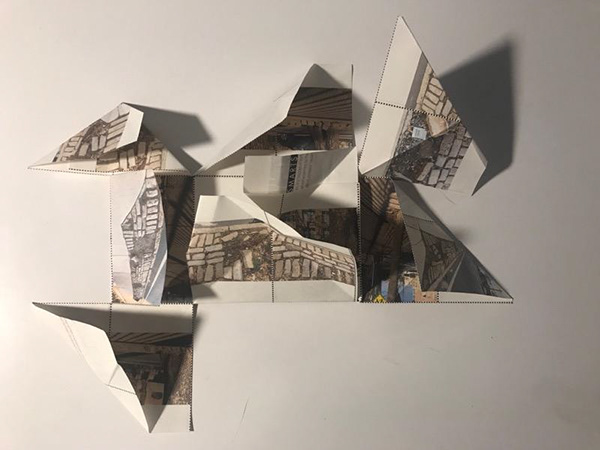
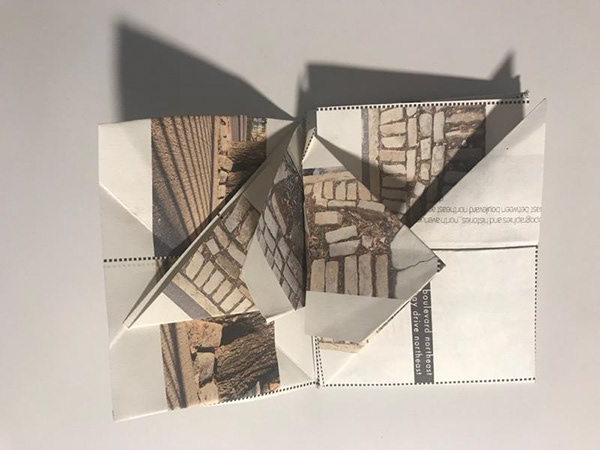
Folding version 2 is cut along the left and right middle grid lines.
Folding version 2 (see caption of preceding image.)
Folding version 2 (see caption of preceding image.)
Folding version 2 (see caption of preceding image.)
Folding version 2 (see caption of preceding image.)
Folding version 2 (see caption of preceding image.)
Folding version 2 (see caption of preceding image.)
Folding version 2 (see caption of preceding image.)
Folding version 2 (see caption of preceding image.)
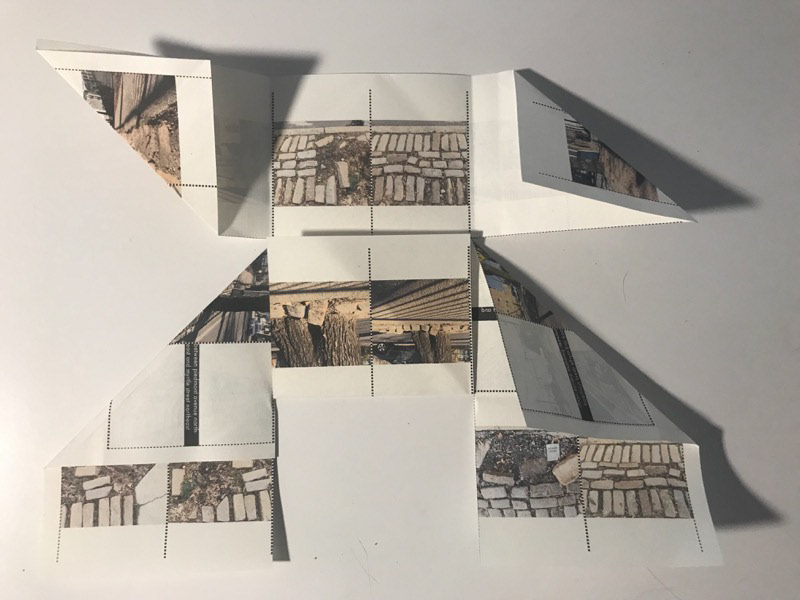
More fold configurations. These photos show first and second versions of the (more) final folded map. The second version is cut along the left and right middle grid lines. (See the preceding caption for description of the first version.) Produced digitally and by hand in Atlanta.
Grids that bind. My maps and photo-collages represent various boundaries of North Avenue that limit and warp the lives of its occupants. These street grids carry different kinds of intelligence, with different smart effects: The curb-bounded street. The pavement-bounded spaces of trees. The pavement-bounded spaces of people. The disintegrating tree stump and its missing companions at the Boulevard intersection. The exposed wires and duct taping of communication lines. The severe pruning of trees that these lines, and the buildings they service, intersect.
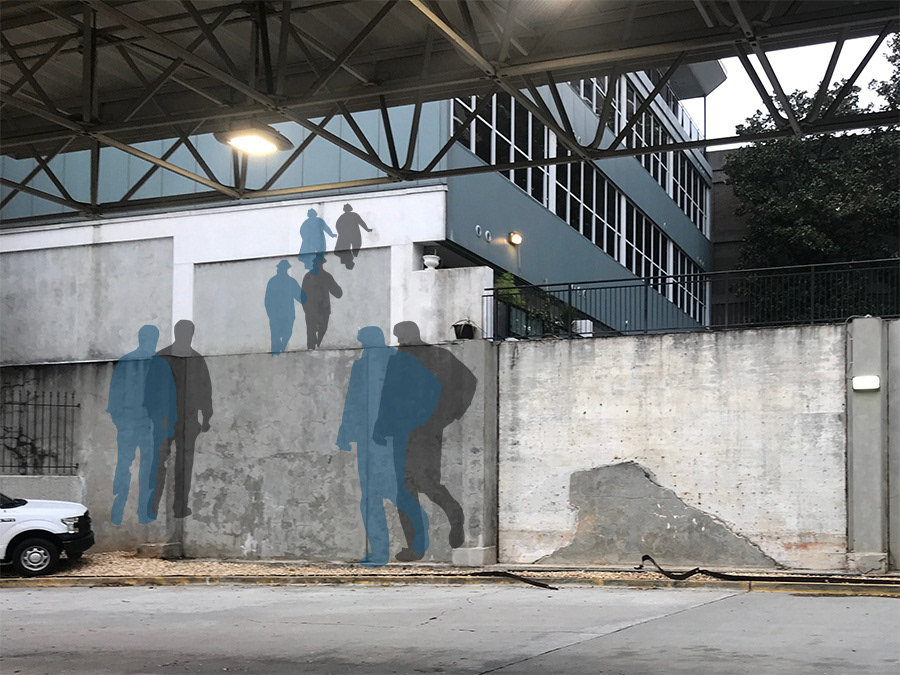
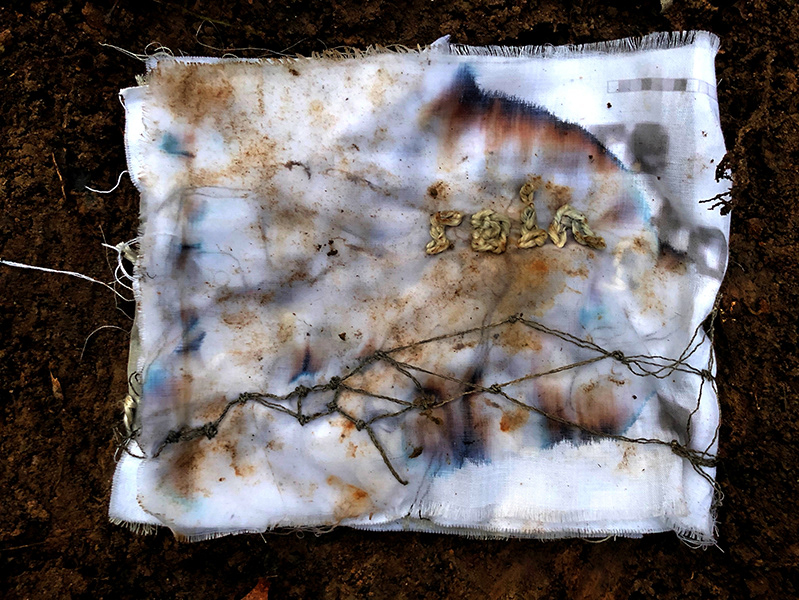
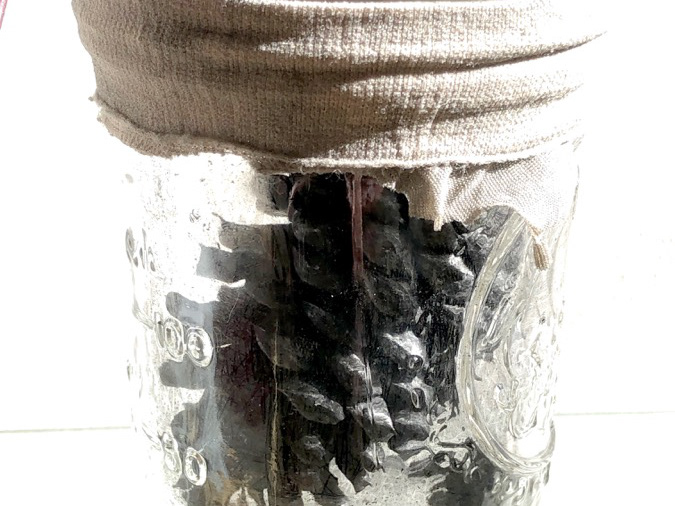
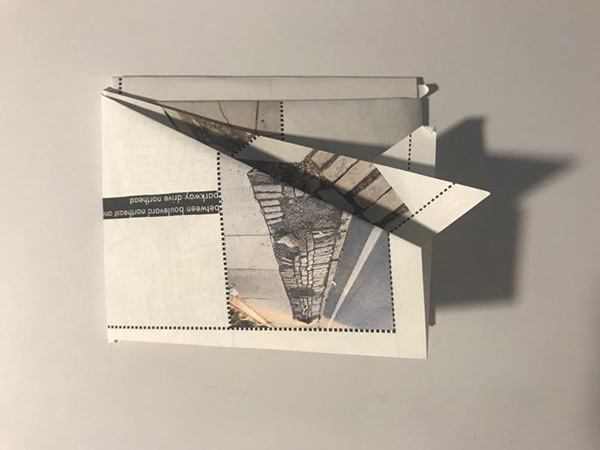
Root drawing on acetate over a postcard found at the intersection of North Avenue and Boulevard NE (and elsewhere along both streets) after the November 2018 election.
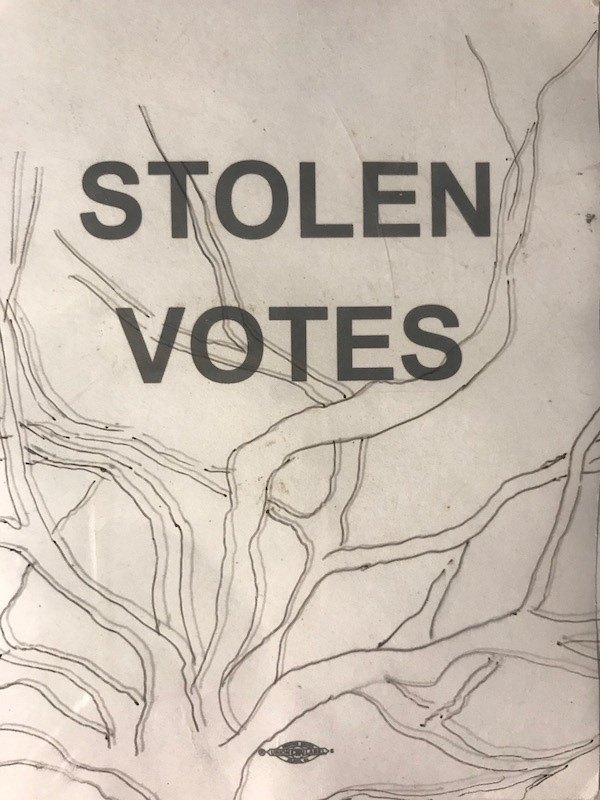
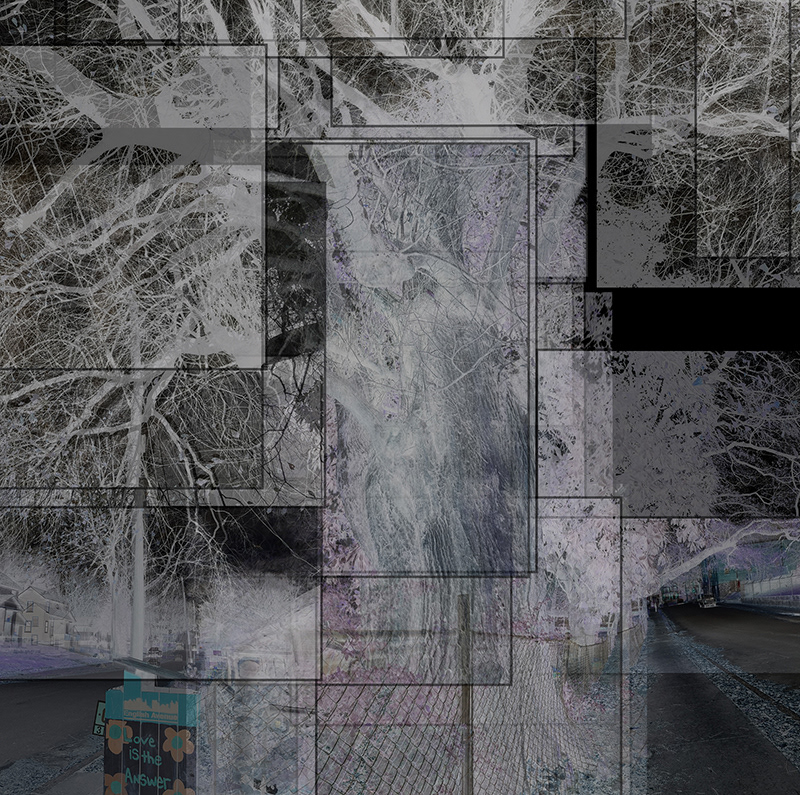
Warps that re-bound. My maps and photos also represent smart occupants and occupations of North Avenue that intelligently push back its gridded boundaries, such as: The massive tree roots that warp topographies of concrete and cobble between street and sidewalk. The initials, messages, and footprints engraved in sidewalk surfaces. The printed "Stolen Votes" postcards littering the Boulevard intersection after the November 2018 election. The minimal pruning of trees at the avenue's west end, a mixed income though gentrifying neighborhood. The newspaper kiosk in this smart neighborhood brightly painted "Love is the answer."
----------------------------------
[PROJECT 2 SUBMISSION FOLLOWS]
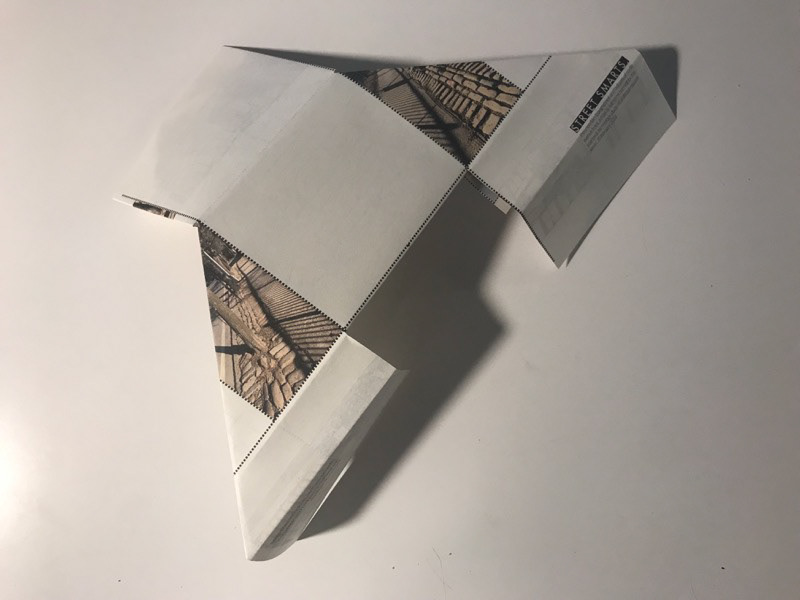
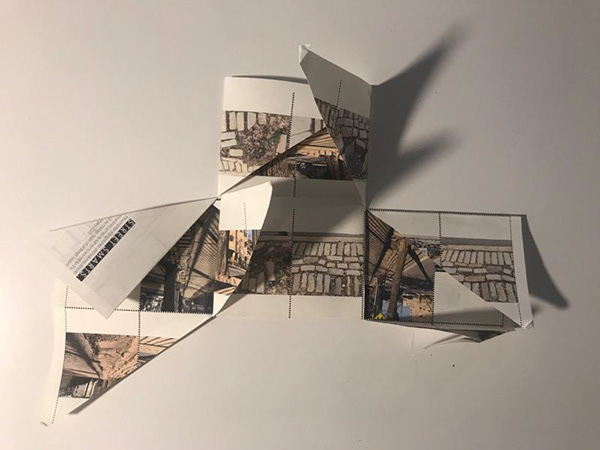
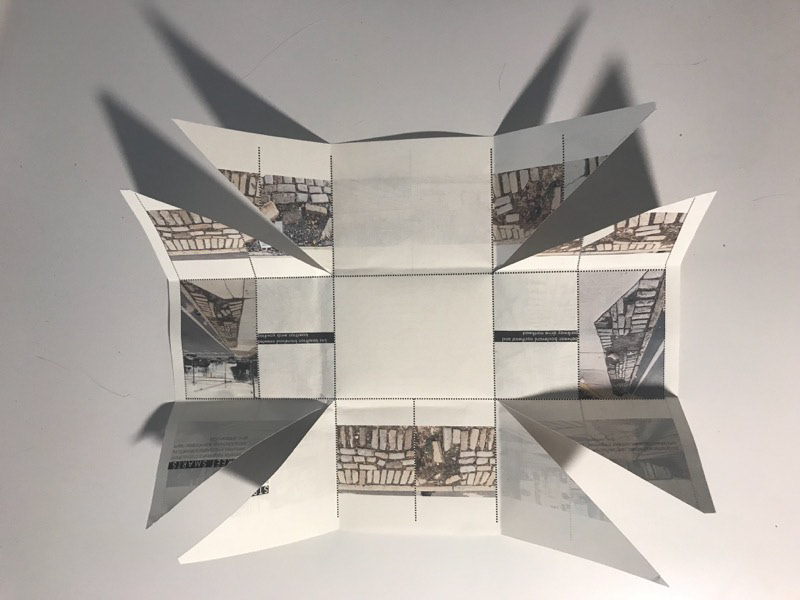
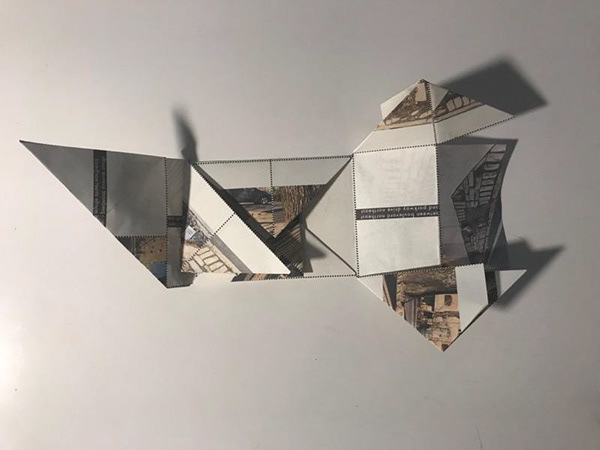
More experiments in map folding: These are my favorite, using diagonal cuts to encourage folding that deviates from the map grid -- though my folds still respond to it.
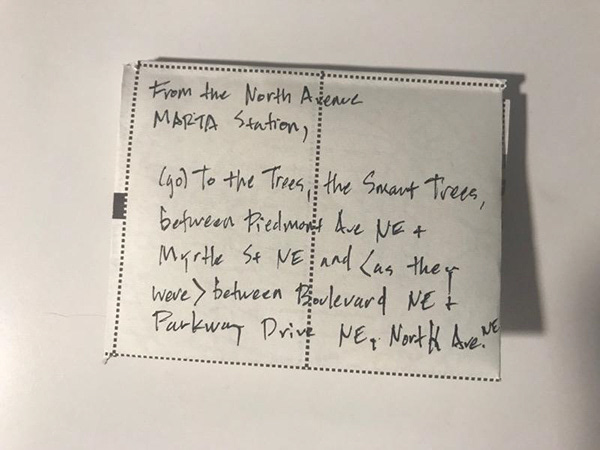
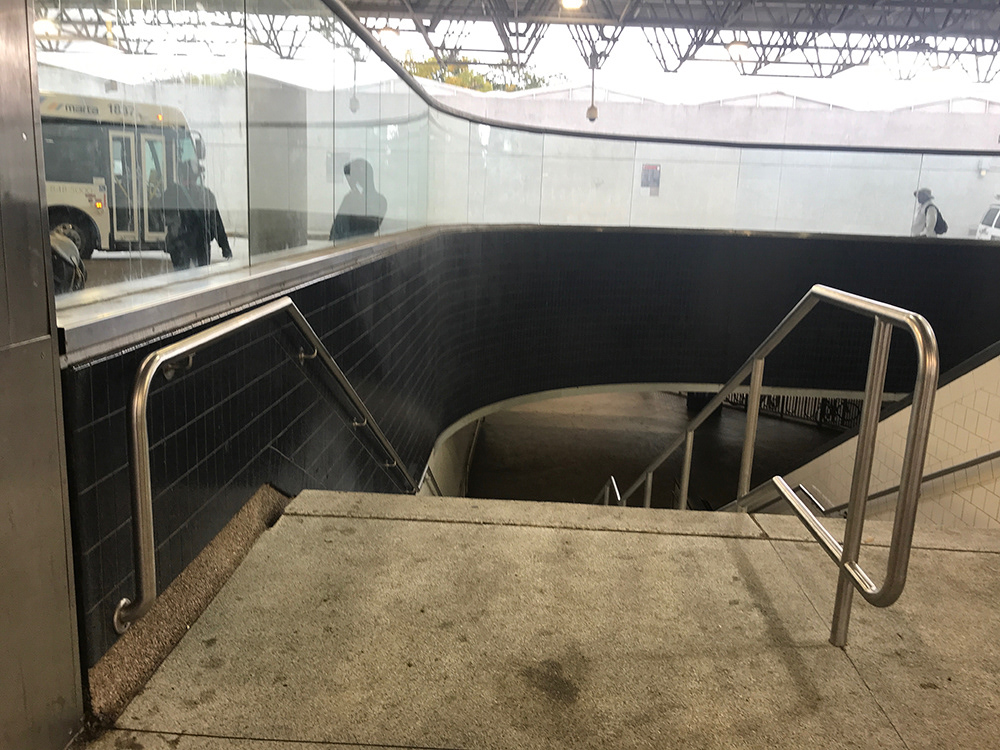
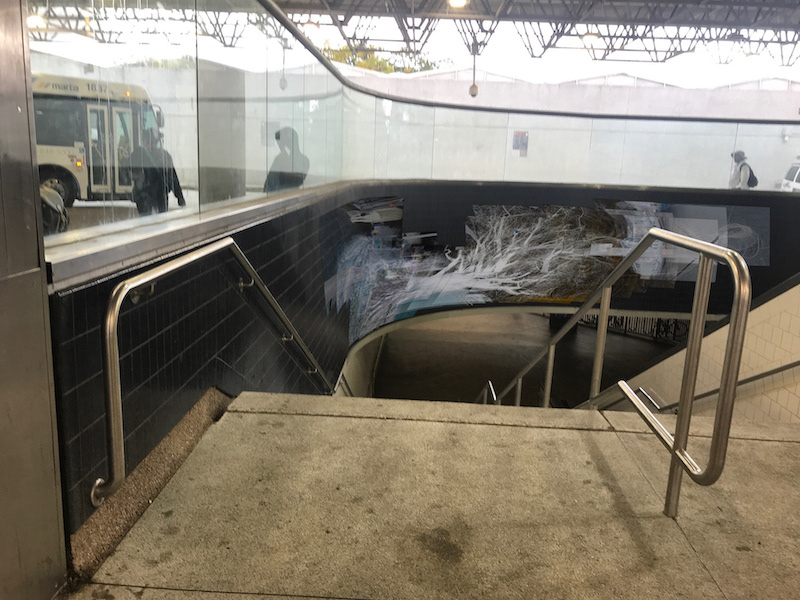
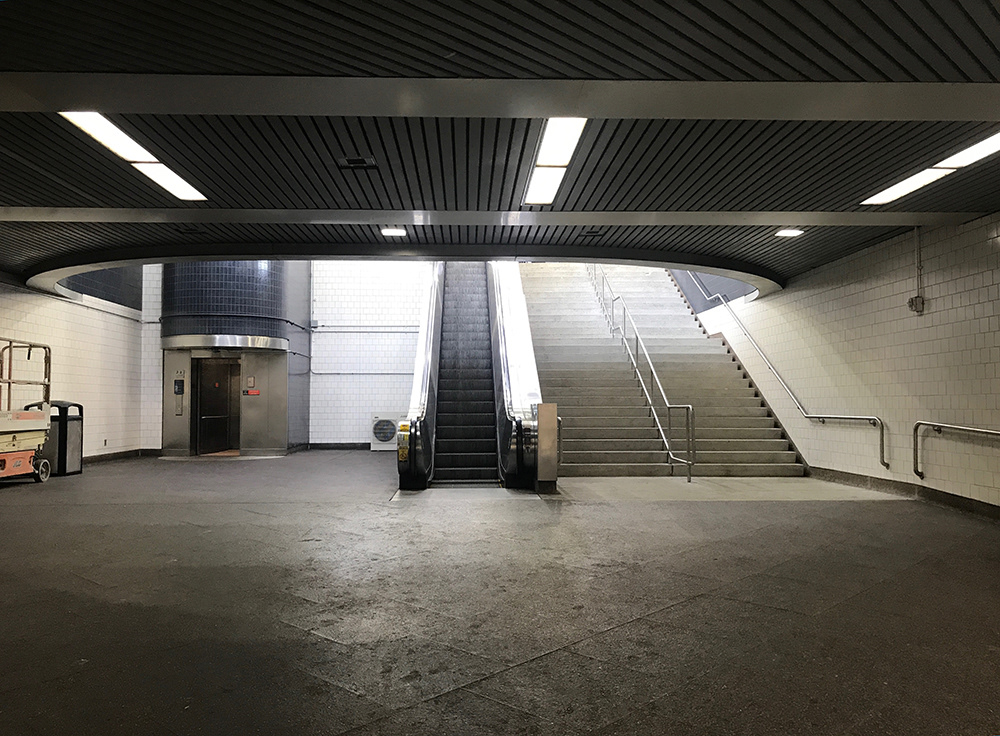
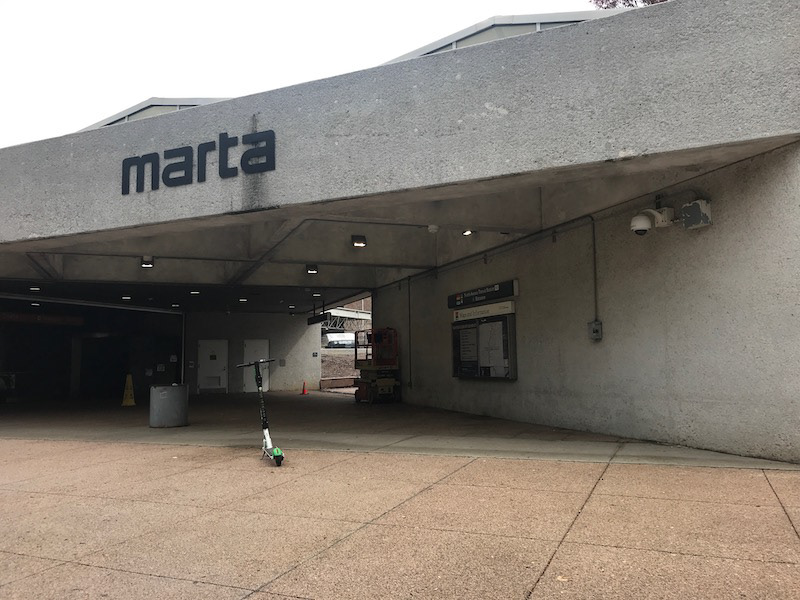
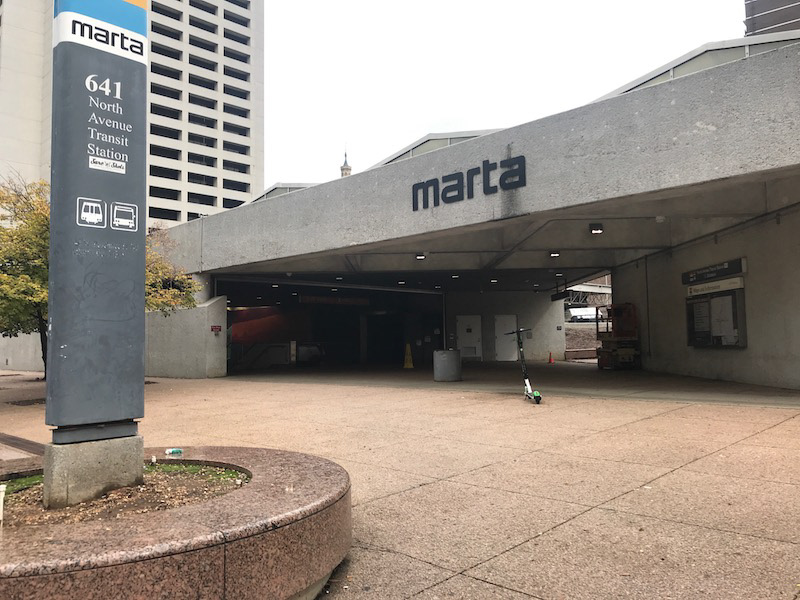
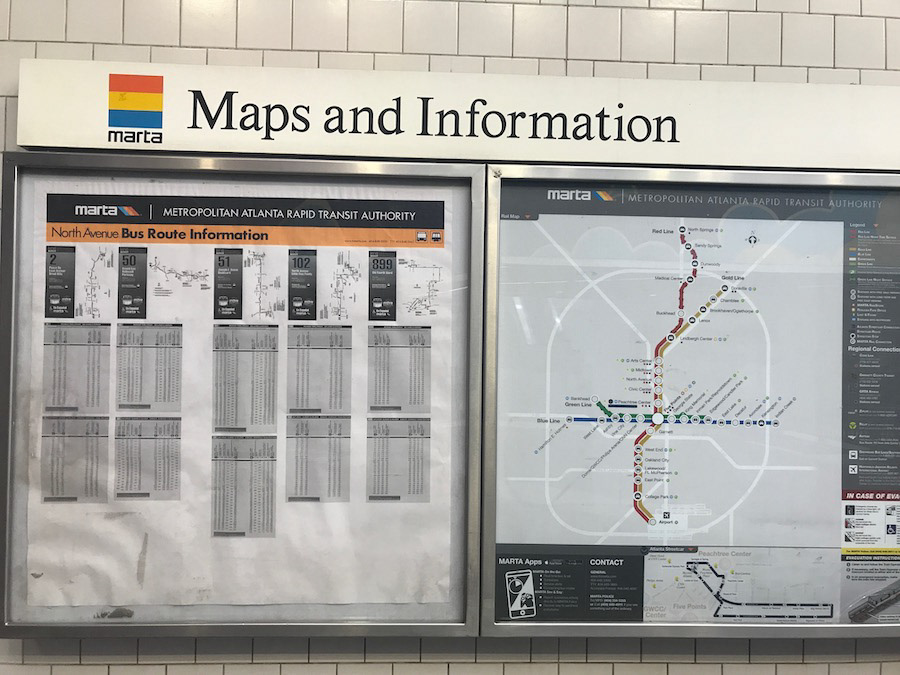
Design proposal: bus and walking tours. The North Avenue MARTA Station serves as a central hub of public transportation on the avenue, and as a point of departure for moving along it. The station thus presents a space for sharing different knowledges of the avenue (Tuhiwai Smith 2012). My folded paper tour maps offer directions from the station to specific trees (and former trees) along the avenue by bus and walking.
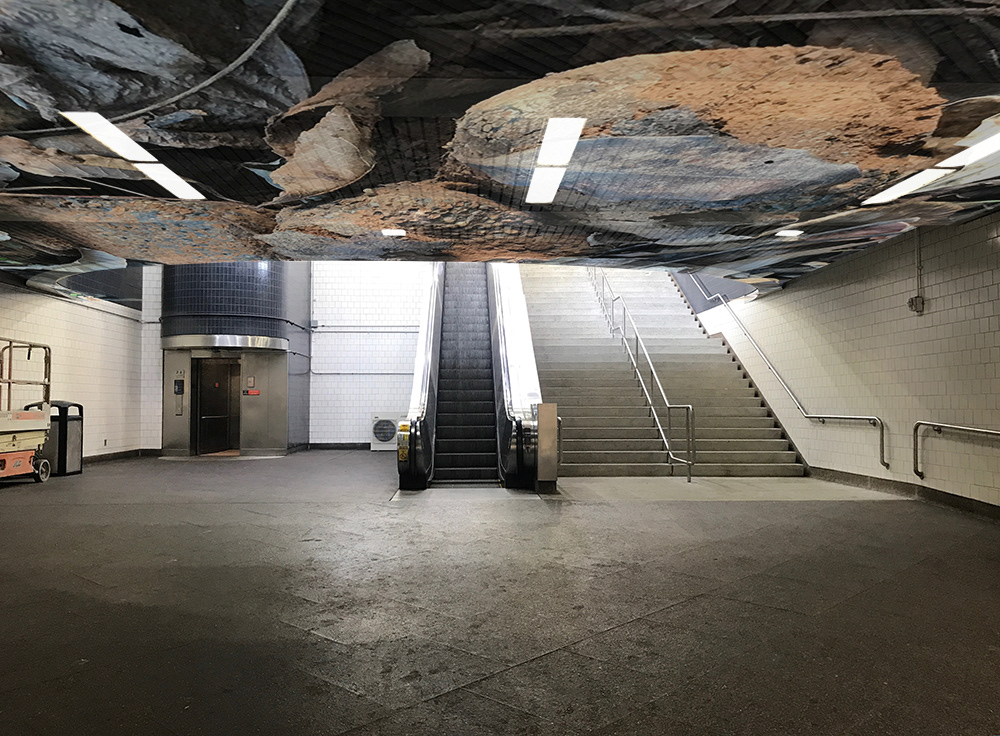
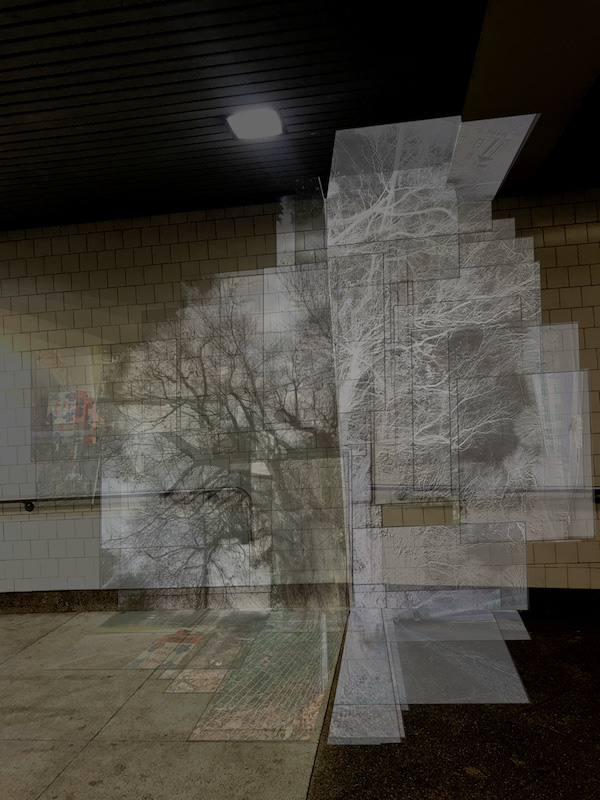
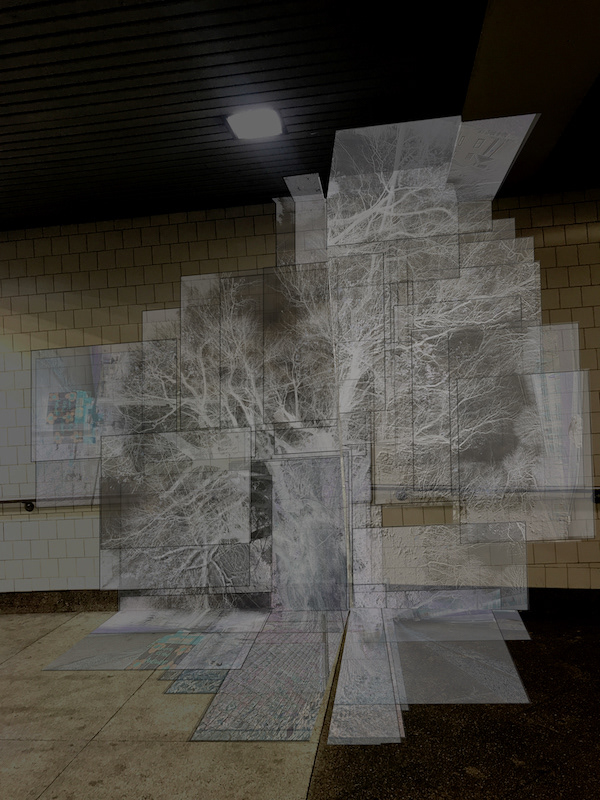
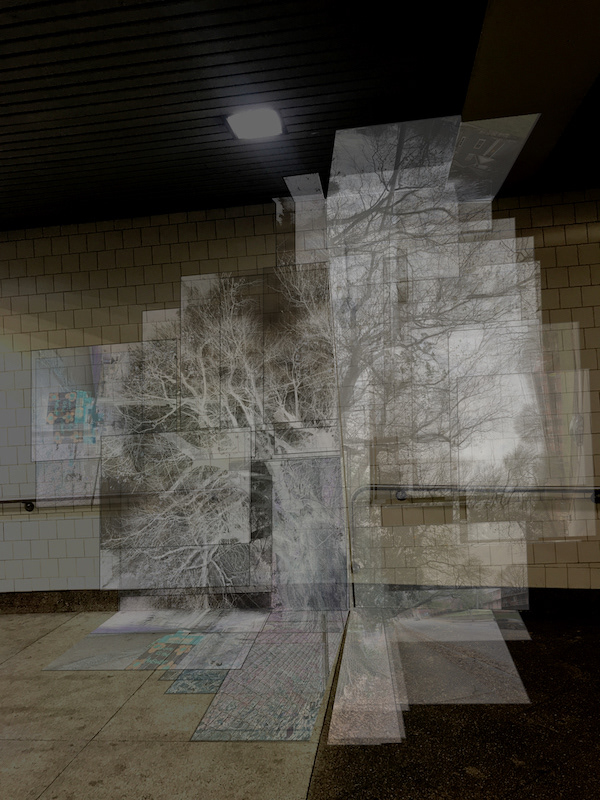
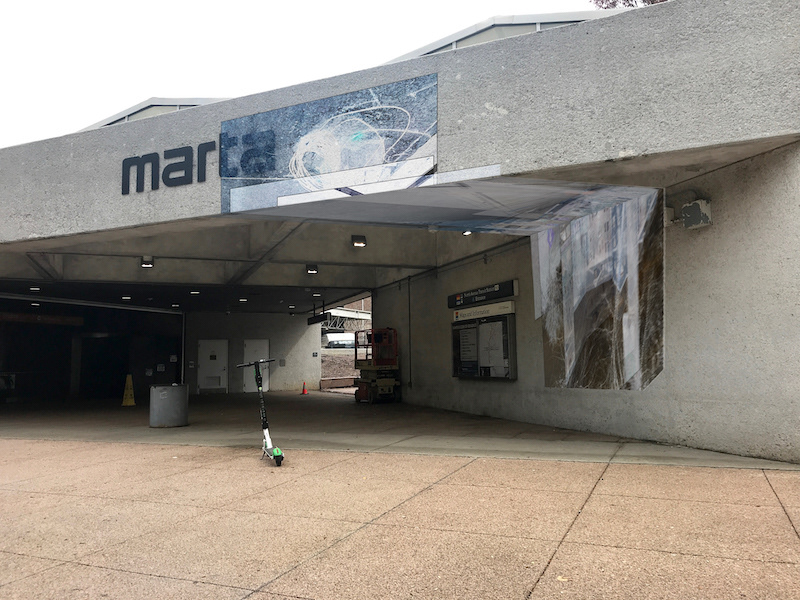
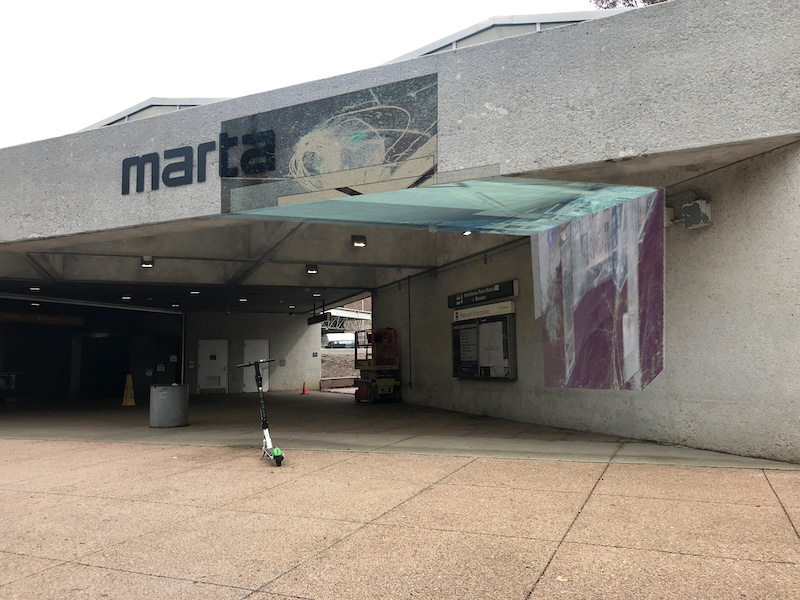
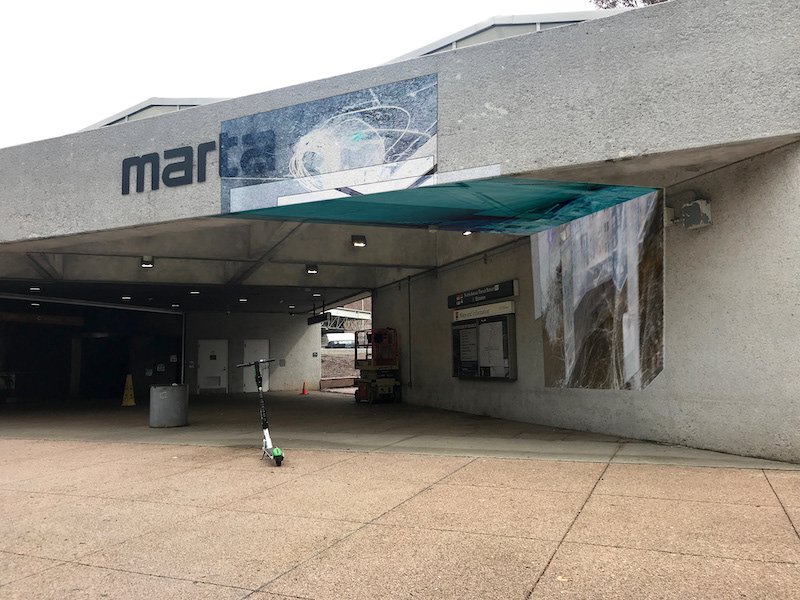
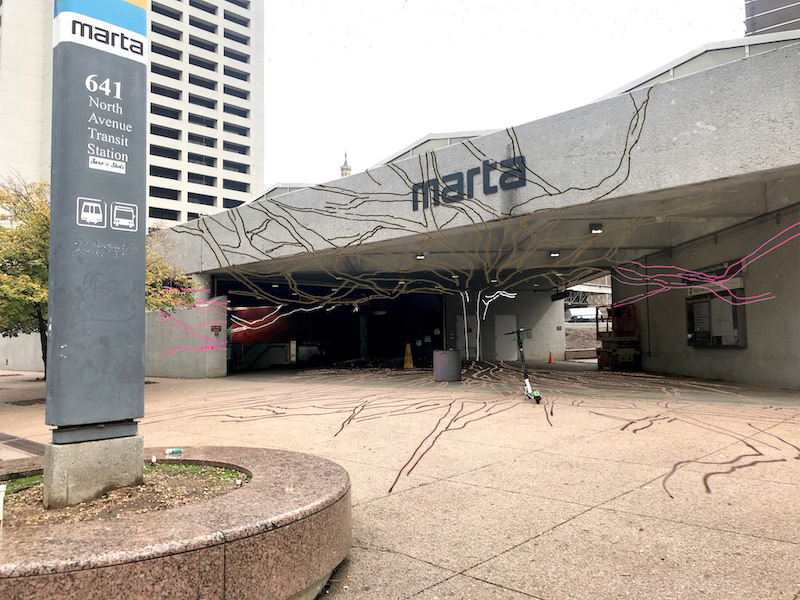
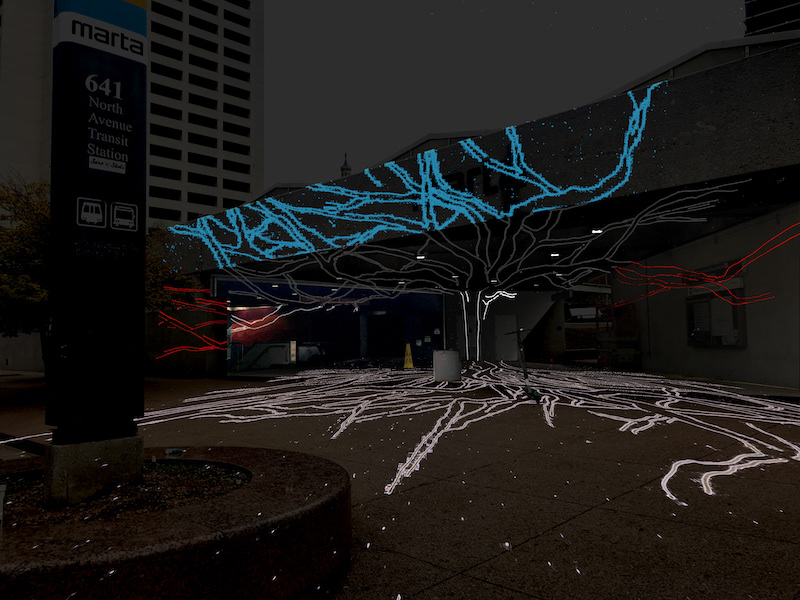
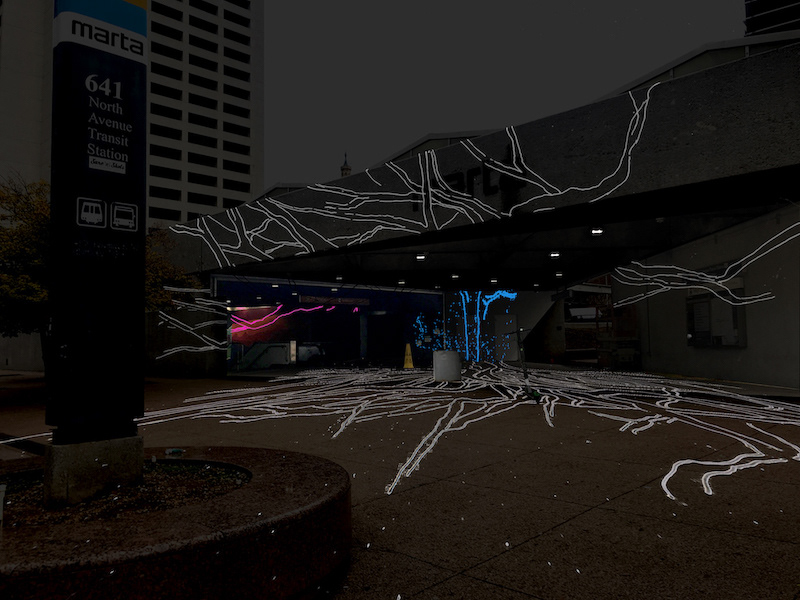
Photos, photo-collages, and root drawings animated and projected on folded surfaces of North Avenue Station.
Representations: moving and still. Projections and screenprints of my photos and photo-collages on the station's walls, ceilings, and floors bring attention to trees as street-smart residents of North Avenue. Mapped onto the station's folded and curved surfaces, the animated projections change colors, view angles, and image sequences through the day. Morning commuters see different images going home in the evening, for example (Nassim Parvin, class critique). Static images printed on clear film and adhered to glass surfaces juxtapose the trees and (silhouetted) people in my layered photocollages. MARTA riders moving through the station, above and below ground, retrace the warped surfaces and rooted networks of Atlanta's oldest, most resilient, and therefore arguably its wisest citizens: Together, the paper maps, projections, and prints re-present these networks in the context of, and physically on, city surfaces that we pass by and walk on daily.
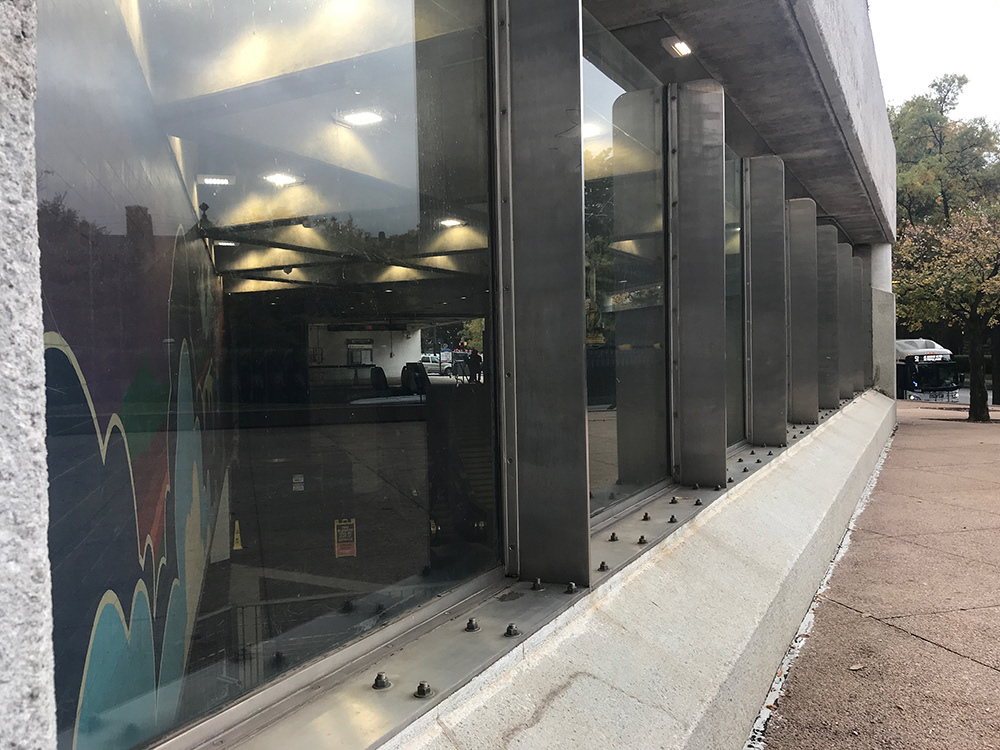
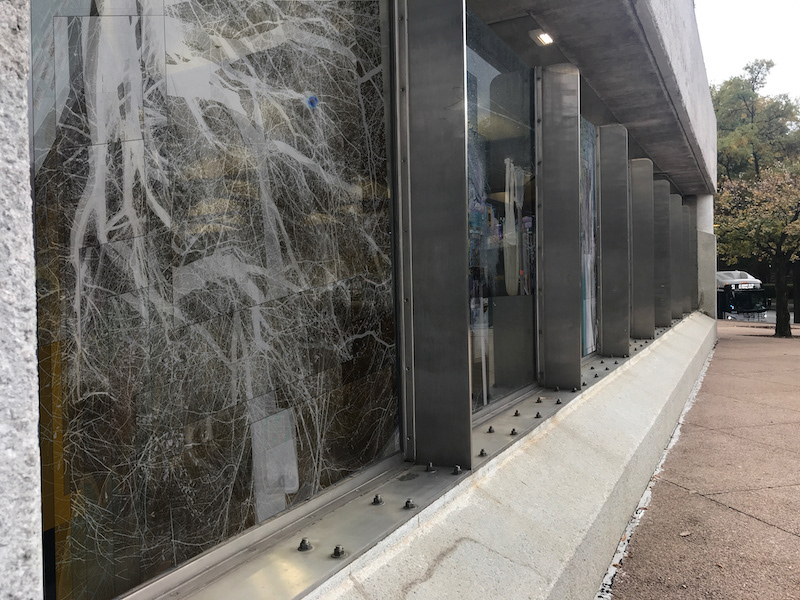
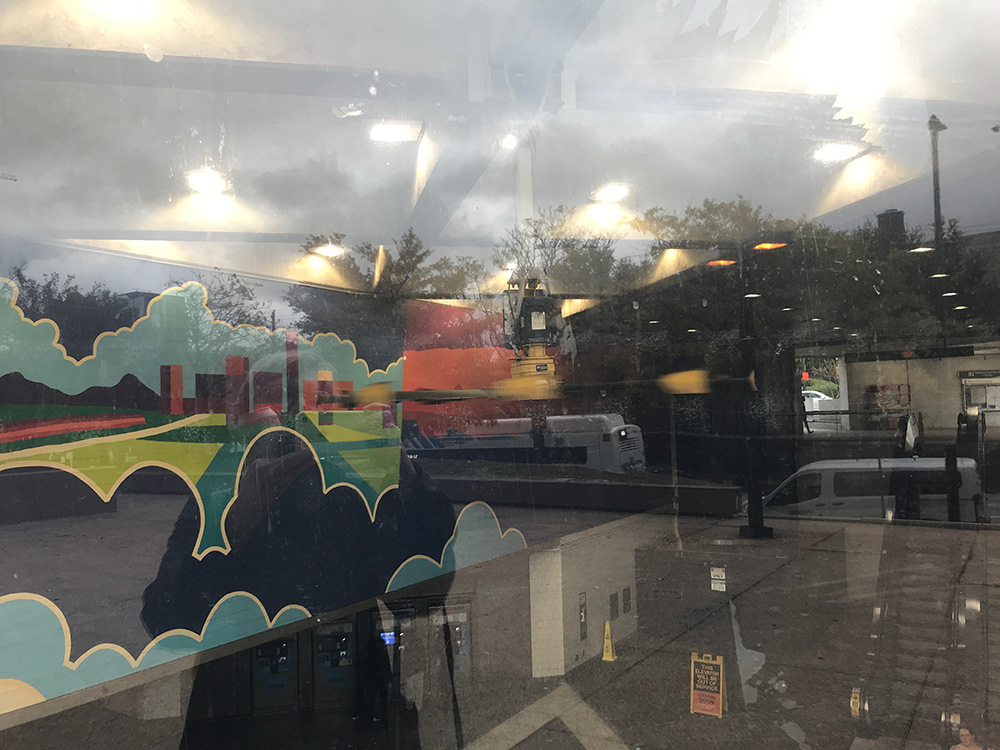
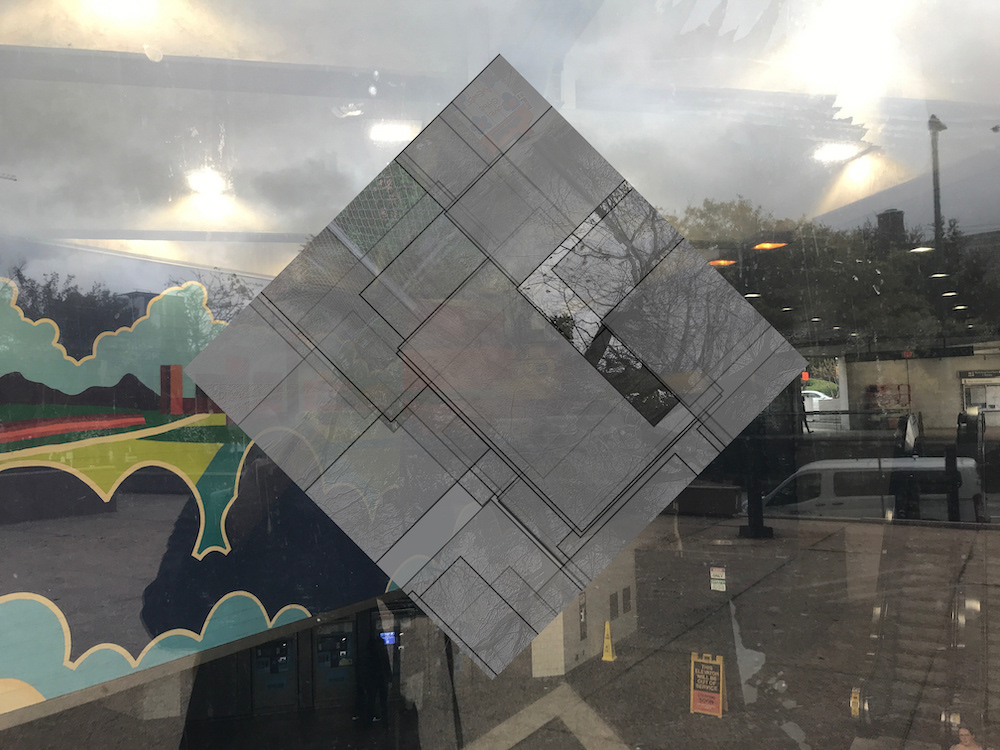
Photo-collages screenprinted and mounted on windows of North Avenue Station.
Meanings: maps (1). Maps engage with knowledge and its production in various ways:
As "spatialized representations" of places, maps situate how we know places (Tuhiwai Smith 2012, 54; see also Haraway 1988).
Transportation maps on the wall in North Avenue Station.
Meanings: maps (2). As tools for finding places, maps direct how we physically know these places, how we physically get to them and bodily move through them. Maps of streets and sidewalks, bike and bus routes, buildings and parks, guide us through the urbanized terrains of cities like Atlanta. Maps thus act as everyday choreographies for living in cities like Atlanta (Jacobs 1961; Hirsch 2014).
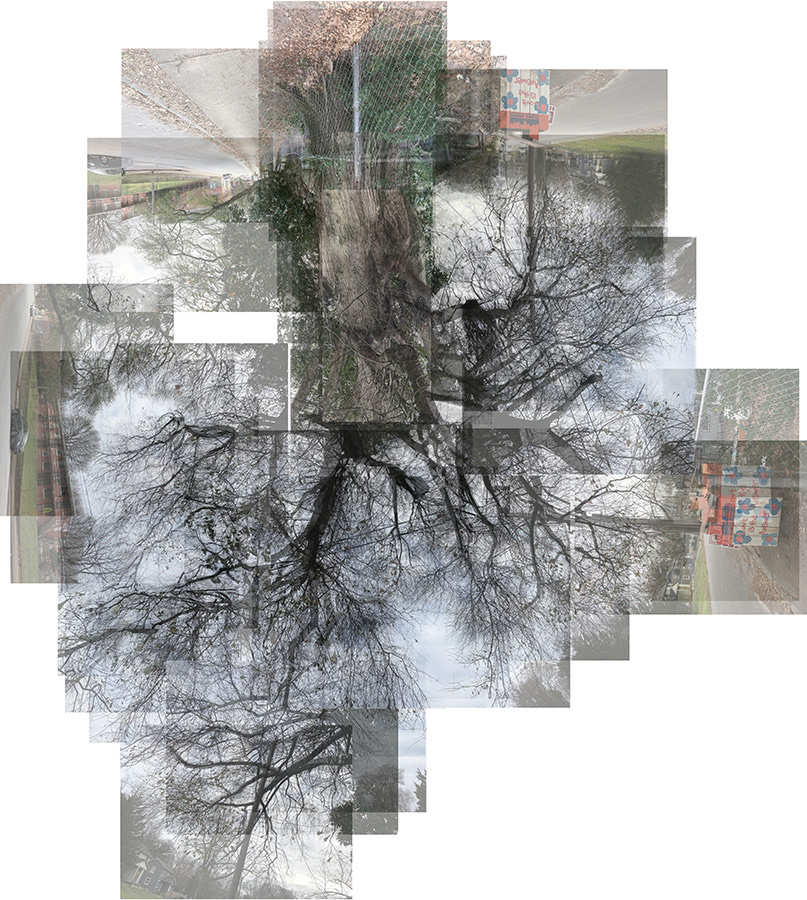
Composite digital photo-collages of street trees, people, and the communication and power lines surrounding and intersecting them along North Avenue near the intersections with Argonne Avenue and Oliver Street (starting from left, Argonne Ave collages alternate with Oliver St). I took the collage photos at different times and from different angles.
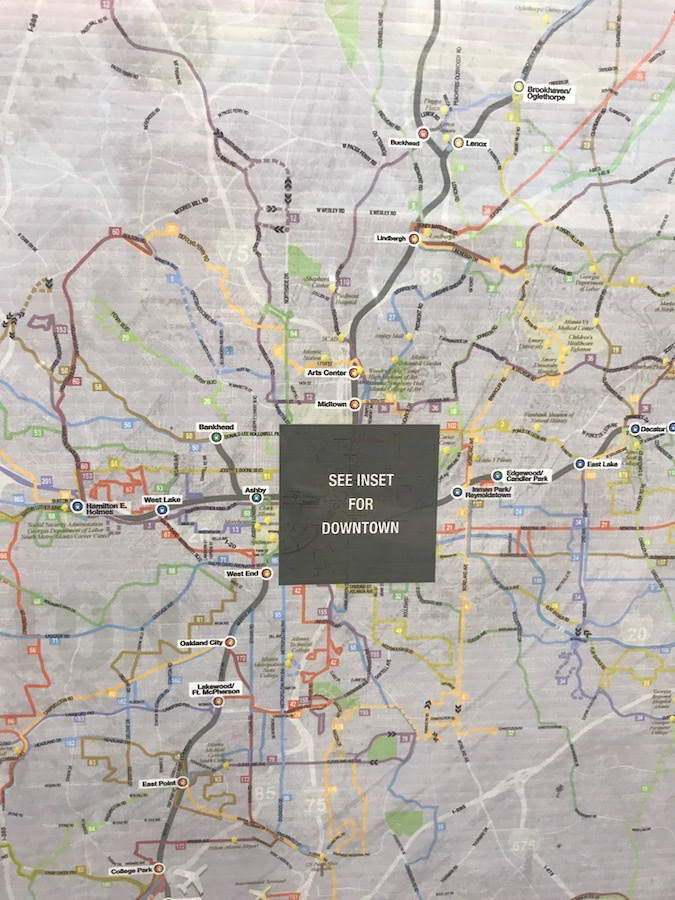
Meanings: maps (3). As media for local, national, and international urban planning and design, maps frame strategies for how we will know places in the future. Government officials, developers, and "land use” planners map changing conditions and relationships of time and space as property and territory, in order to negotiate the knowing of time and space on these terms. Maps of the U.S. and Georgia position Atlanta as a center for state politics, business, and education, deploying “systems of classification and representation...[that] help determine what counts as real” (Tuhiwai Smith 2012, 46). (see historic map examples at top of this page). By representing these power-imbued terms of knowledge, maps enact them. Maps thus realize these quotients of urban intelligence, "of place and of relationships to the land," even before permit-holding developers and hourly-rate laborers bulldoze, uproot, and otherwise demolish the living environments and networked communities of city streets (57).
Alternating enlargements of the Oliver Street and Argonne Avenue photo-collages.
Meanings: maps (4). As records of different populations and communities living within the so-called city "limits," maps register different (hi)stories and perceptions of it. Tuhiwai Smith examines how our stories of time and space (one word in the Maori language) also participate in creating what can become real.
More experiments in folding through a design probe: Another student in the Digital Media program folded these two maps. In the first version, she followed the map grid lines (2 photos, top left). In the second, she followed diagonal cuts, made in response to the first folding, as well as lines. Described further below.
Meanings: folds (1). Folds occur in the physical time-space of moving and changing bodies. A fold is a turning over, a changing of space and spatial direction. Folding changes both spaces and perspectives of spaces. Folding can challenge spaces and spatial orientations as they are now: for example, the changeable folds of my paper maps. But folding can also reinforce spaces and spatial orientations as they are now: for example, street curbs.
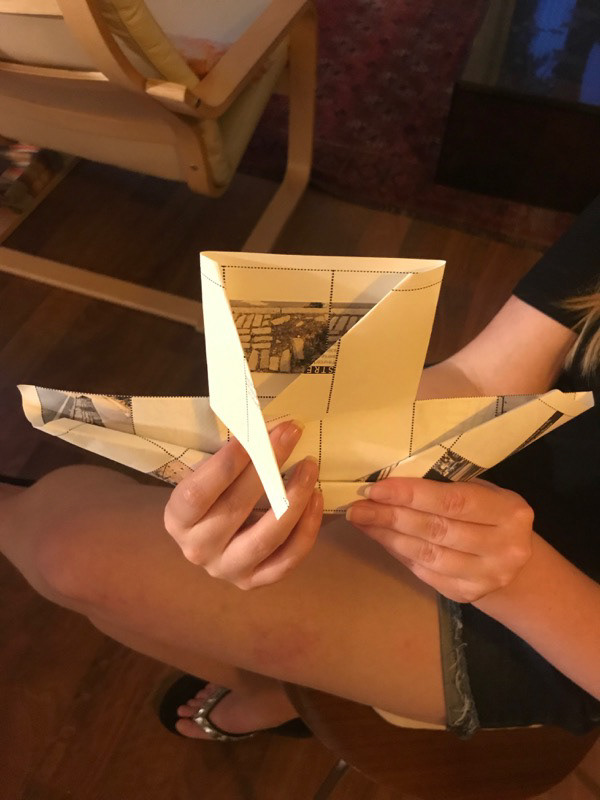
More experiments in folding through a design probe (2): This re-folding of the first map by the same DM student follows but also deviates from the map grid, as described further below. See the video at bottom of this page for a demonstration of the folded owl-map in flight.
Meanings: folds (2). I used my test-prints from earlier in the semester as a mini "design probe" to explore different folding possibilities with another Digital Media student. Following my abstract request that she fold the map however she wanted, my design comrade said she preferred to follow the grid lines because she's "not good at craft." She liked how her final fold in this iteration reversed the image orientations. In response to her reluctance to fold against the grid, I cut another map diagonally across the grid corners. She liked the resulting, "more elegant" folds better than those in the first trial. These folds react to my diagonal cuts as well as the pre-printed grid lines. Like my own folds of this version (at top of this section), these folds don't deviate from the implicit directions of the map grid and cuts. I then gave her the first map back, asking if the happier result from her diagonal folds might lead her to a different folding approach to this map. She proceeded to create symmetrical diagonal folds. But after noticing that these diagonals created a "beak," she started rolling the paper to form the "rounded" wing contours of her favorite bird, an owl. She liked this last version of her folded map the best, and demonstrated the owl flying (see video at bottom of this page). She of course noticed the tree photos and text in the maps, but we didn't discuss the project's focus on interactions and sharing between trees and people until after she made her owl.
Animation of my in-process folding diagram, not yet updated to reflect diagonal, owl, and crumple folds deviating from the grid (crumple photos below). Click on the image to start the animation. The full series is at the bottom of this page.
Meanings: lines. People draw lines to denote property and territory in paper and digital maps (Tuhiwai Smith, 52-53). I have drawn lines in my maps to represent the locations of folds, which are also encoded with meaning. A line designates a meaningful changing and redirection of space, an edge and a boundary. As a line represents both edge and boundary, it can act as an “excitable” agent of change and redirection (Butler 1997): for example, the lines on my re-foldable paper maps. But a line can also represent a reinforcement of existing edges and boundaries, and spaces and spatial orientations, as they are now (ibid.): for example, property lines. Lines are meaningful and intentional. They represent what people mean and intend to do with space as a temporal condition -- and time as a spatial condition (Tuhiwai Smith 52, 55).

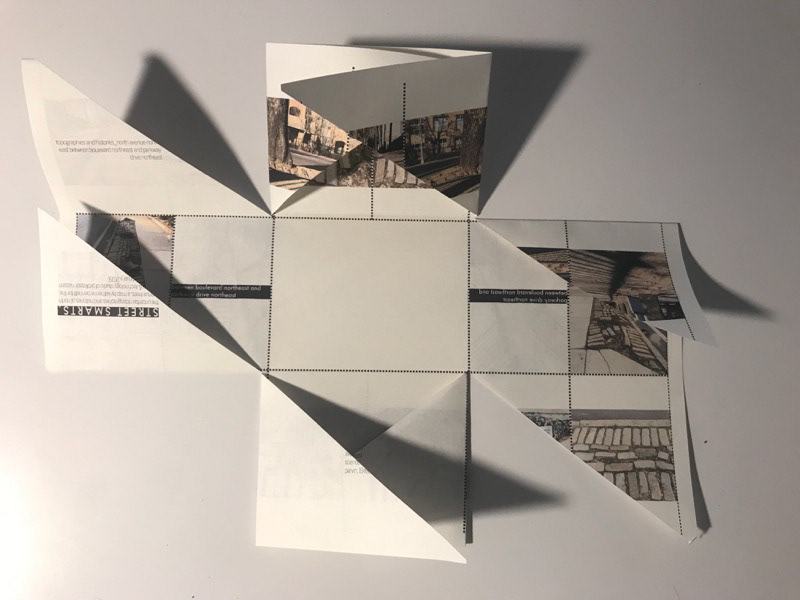
More experiments in map folding (before the design probe studies): Though my cuts still followed the map grid, my diagonal folds cross and subdivide it.
Questions. We need folds and lines. We need them as edges, to change and reorient perspectives of space. We also need them as boundaries, to protect and hold space for us to live in. But edges and boundaries can cut off the connections between spaces and perspectives, severing communications between them. So: How can we change the ways we grid the city and its streets and lines of communication to protect and hold spaces for different perspectives, refolding redirections, and “mutually transformative” changes (Tsing 2012)? And what could these folded spaces look, feel, and act like? That is, how can they represent and share the potential for change?

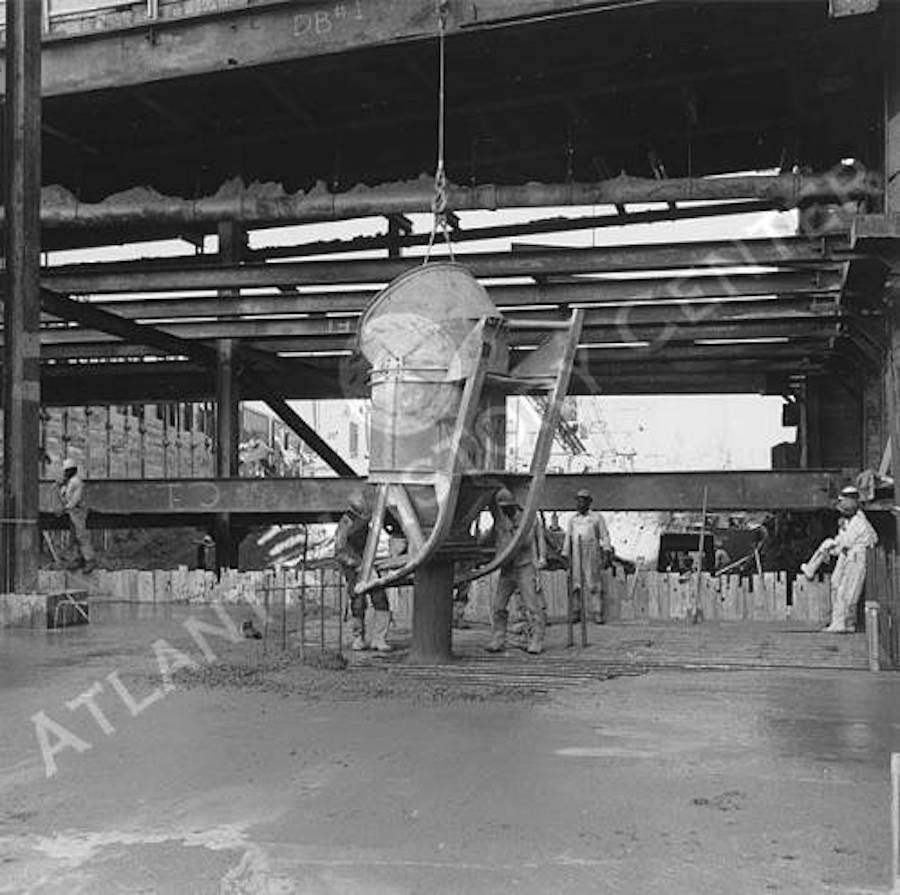
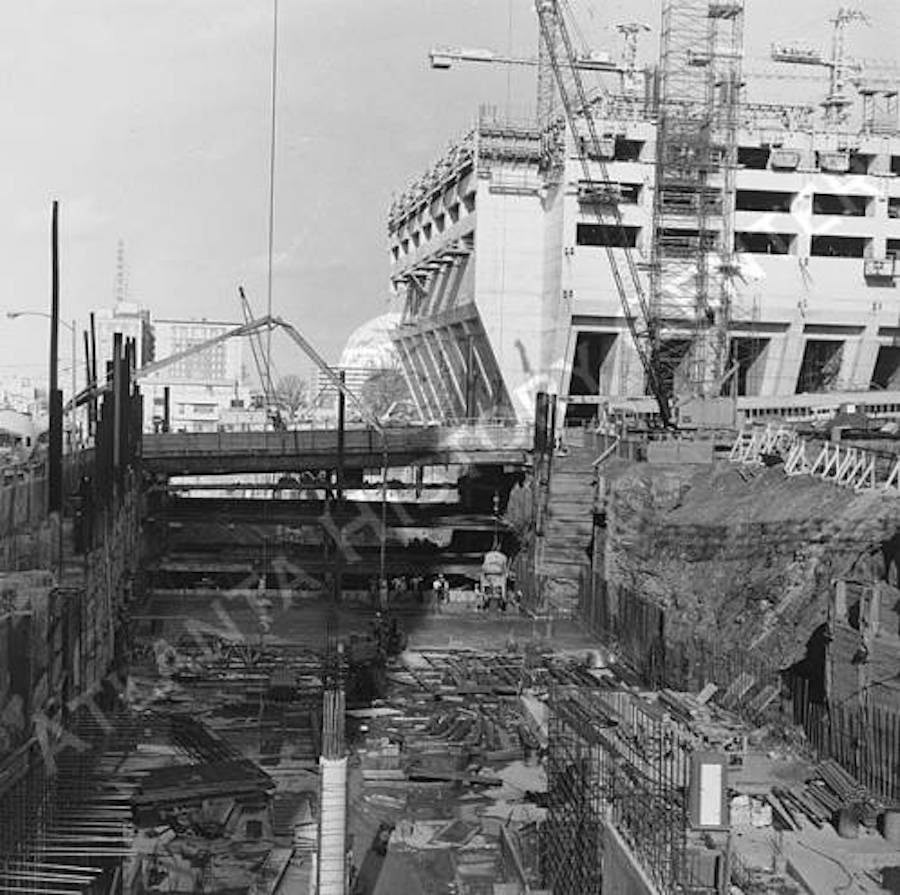
from left: (1-3) Photos of old trees near the intersection of North Avenue and Boulevard NE, Bennett. (4) Historic photo near the intersection of Ponce de Leon Avenue and Boulevard NE, Atlanta History Center. (5-6) Historic photos of North Avenue Station's construction, Atlanta History Center.
Hypothesis. The powerful, communicative exchanges of tree networks offer responses to these questions. Their sharing of essential nutrients across space and time represents the communicative care and life-support of mutually transformative communities. Their rooted, interactive networks act within and between the street and property grids of our urban fabric, recoding it with the exchanges necessary to support life. These exchanges occur mostly below ground, through encoded material messages and timed transfers of materials—not unlike the buried communication lines of human and “smart city” networks. But, like the people that create these networks, the tree and mushroom agents of material exchanges also live above the surface, reshaping the ground for access to spaces of air, water, and sun. They resiliently claim and reclaim space above and below ground. They refold the spaces of city surfaces.
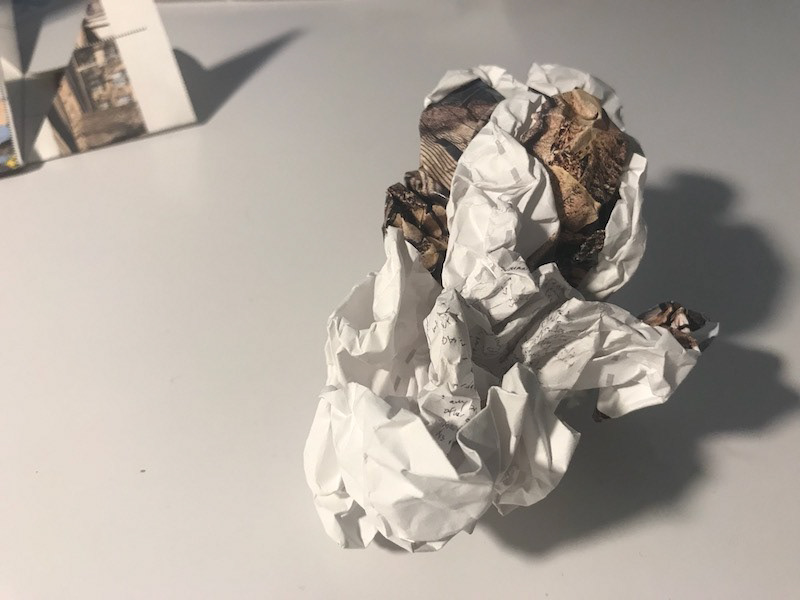
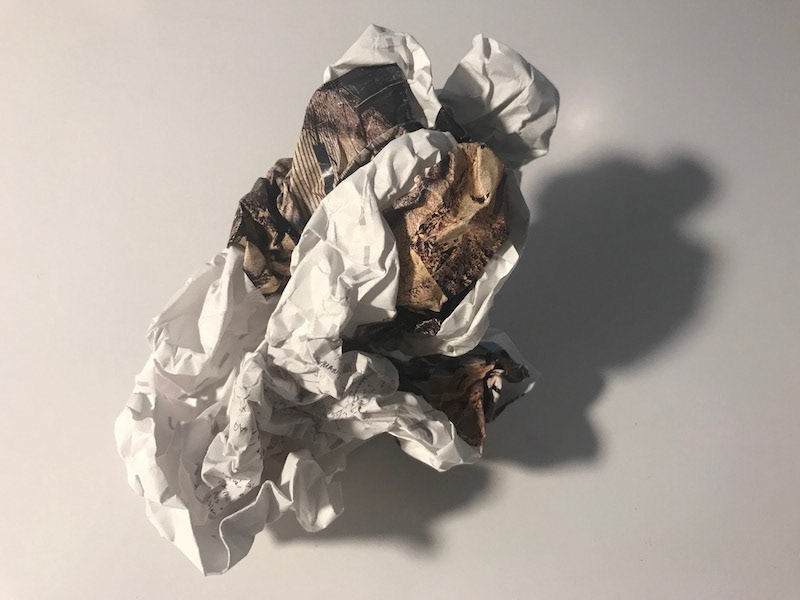
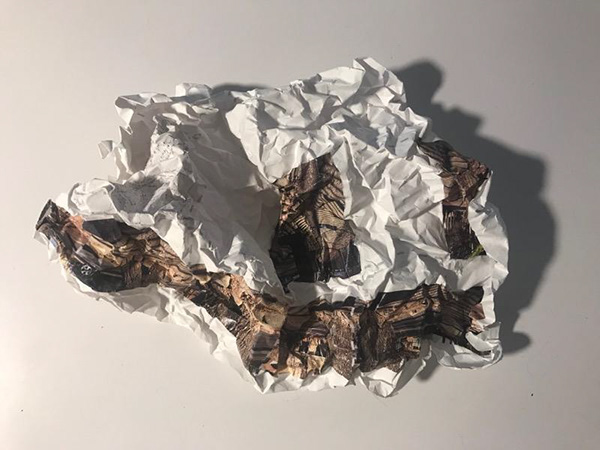
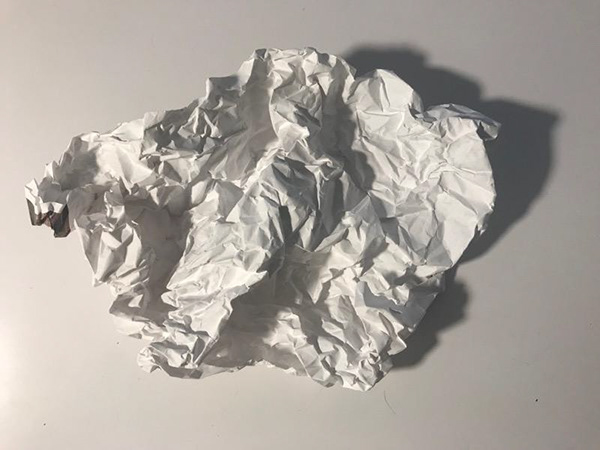
More experiments in folding: Crumpling creates strange objects, altered perspectives, and new topographies.
Inquiry and imagination. Through this project, I've followed a circuitous process of "joint inquiry and imagination" described by pragmatic philosopher John Dewey (in Steen 2013). Nassim examined this process as "a dialectic of means and ends" in her PhD dissertation and co-authored essay on social values in design (JafariNaimi et al 2015, 97). In this process, my questions and responses have iteratively opened and closed, changed and limited, and reimagined and requestioned each other. My favorite two products of the project, the Stolen Votes collage and the diagonally cut and folded map, emerged through interactions with the creative works of others (the designers of the Stolen Votes cards, the folding techniques of an owl-loving colleague).
Demonstration of a folded map-owl in flight by its creator. We didn't discuss the project's focus on trees until after the folding experiment.

In-process diagrams of the map folding process, to be updated with more to illustrate diagonal, owl, and crumpled folds.